Overview
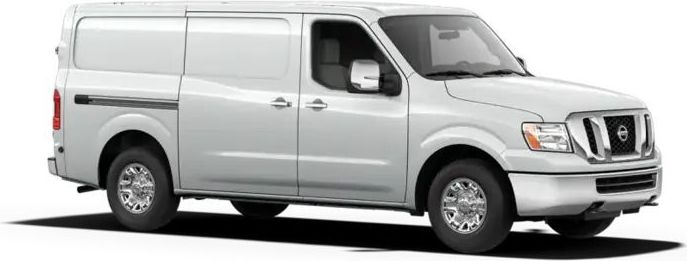
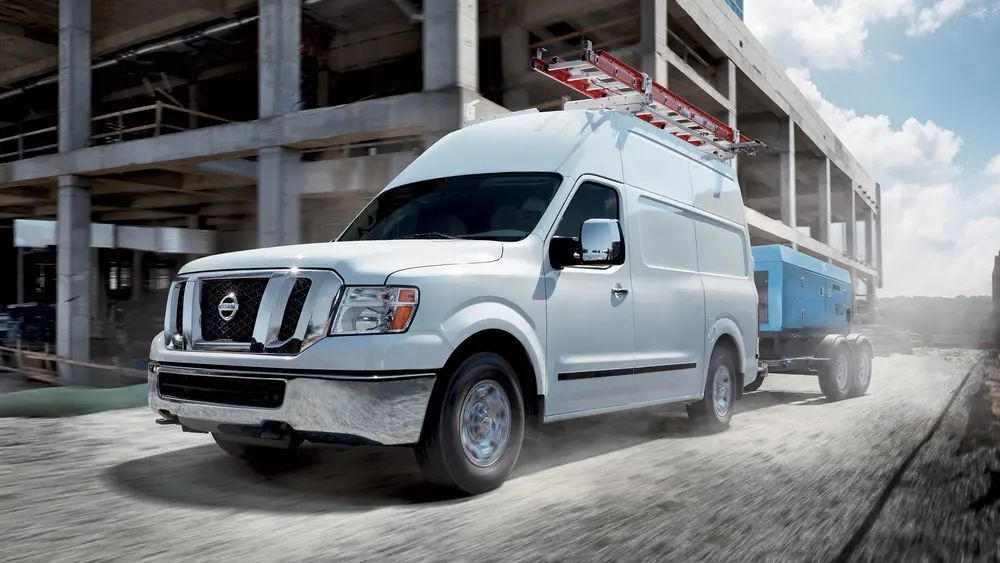
The Nissan NV Passenger NV3500 HD is a Passenger Van with room for 12 people.
How Much Does the 2020 Nissan NV Passenger NV3500 HD Cost?
The 2020 Nissan NV Passenger NV3500 HD starts at $36,110 MSRP. Fully loaded, the Nissan NV Passenger NV3500 HD will cost you about $42,860.
Nissan NV Passenger NV3500 HD Engine, Transmission, and Performance Numbers
Nissan NV Passenger NV3500 HD includes a 4.0-liter V-6 engine combined with a 5-speed automatic. This delivers 261 hp with 281 lbs.-ft. Torque delivered through a RWD drivetrain.
2020 Nissan NV Passenger NV3500 HD Specifications
The has a curb weight of 6,710 lbs. With an interior passenger volume of 238.1 cu. Ft.
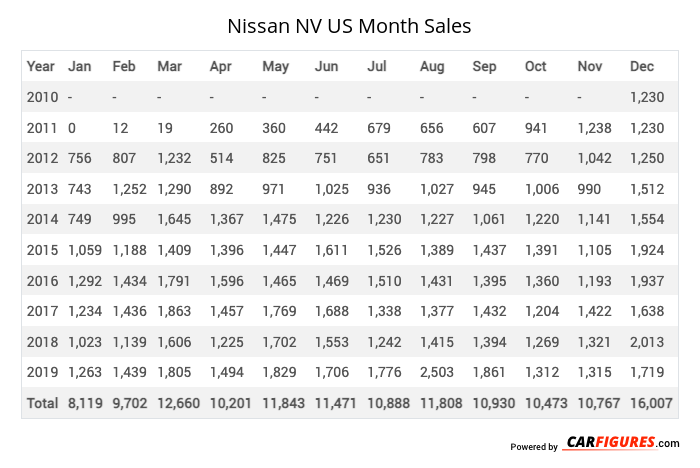
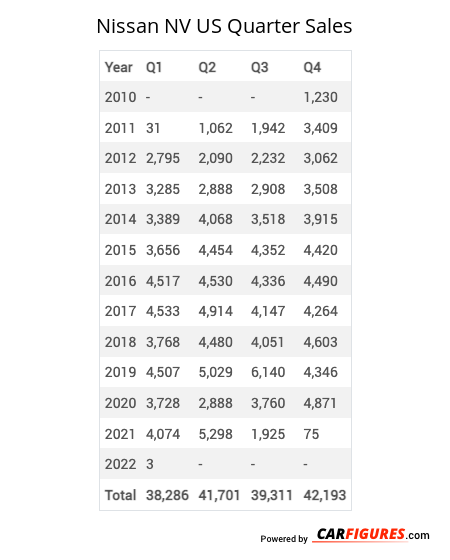
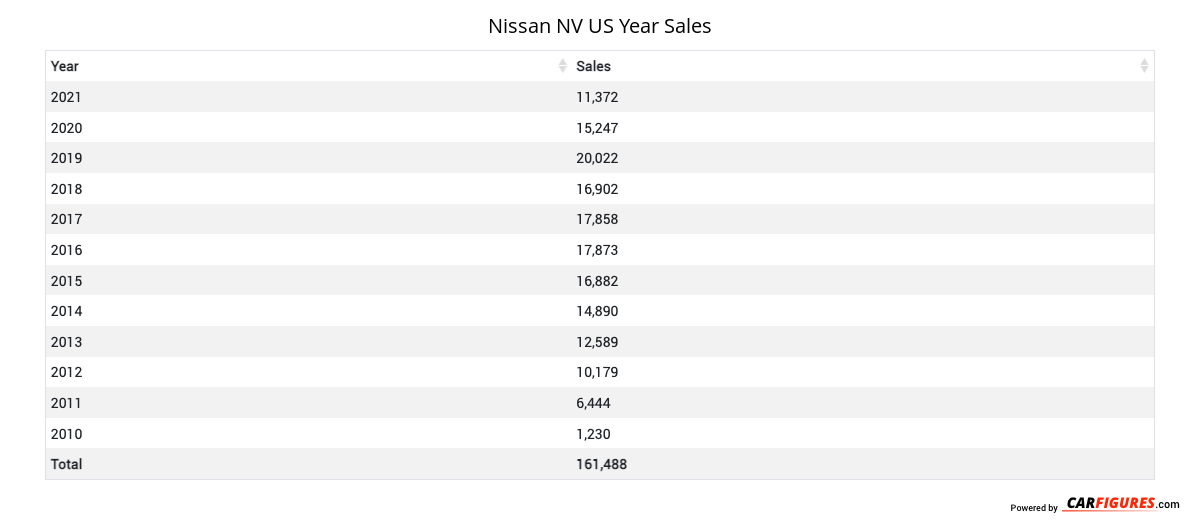
Nissan NV United States Sale figures by year, quarter, and month are presented below. Including the most up to date sales data for the Nissan NV. See how the Nissan NV stacks up the other models in the Cargo/Passenger Vans, Vans segments.
For sales numbers of the Nissan NV in Canada, click here.
Loading, please wait
Year | Jan | Feb | Mar | Apr | May | Jun | Jul | Aug | Sep | Oct | Nov | Dec |
|---|---|---|---|---|---|---|---|---|---|---|---|---|
| 2010 | - | - | - | - | - | - | - | - | - | - | - | 1,230 |
| 2011 | 0 | 12 | 19 | 260 | 360 | 442 | 679 | 656 | 607 | 941 | 1,238 | 1,230 |
| 2012 | 756 | 807 | 1,232 | 514 | 825 | 751 | 651 | 783 | 798 | 770 | 1,042 | 1,250 |
| 2013 | 743 | 1,252 | 1,290 | 892 | 971 | 1,025 | 936 | 1,027 | 945 | 1,006 | 990 | 1,512 |
| 2014 | 749 | 995 | 1,645 | 1,367 | 1,475 | 1,226 | 1,230 | 1,227 | 1,061 | 1,220 | 1,141 | 1,554 |
| 2015 | 1,059 | 1,188 | 1,409 | 1,396 | 1,447 | 1,611 | 1,526 | 1,389 | 1,437 | 1,391 | 1,105 | 1,924 |
| 2016 | 1,292 | 1,434 | 1,791 | 1,596 | 1,465 | 1,469 | 1,510 | 1,431 | 1,395 | 1,360 | 1,193 | 1,937 |
| 2017 | 1,234 | 1,436 | 1,863 | 1,457 | 1,769 | 1,688 | 1,338 | 1,377 | 1,432 | 1,204 | 1,422 | 1,638 |
| 2018 | 1,023 | 1,139 | 1,606 | 1,225 | 1,702 | 1,553 | 1,242 | 1,415 | 1,394 | 1,269 | 1,321 | 2,013 |
| 2019 | 1,263 | 1,439 | 1,805 | 1,494 | 1,829 | 1,706 | 1,776 | 2,503 | 1,861 | 1,312 | 1,315 | 1,719 |
| Total | 8,119 | 9,702 | 12,660 | 10,201 | 11,843 | 11,471 | 10,888 | 11,808 | 10,930 | 10,473 | 10,767 | 16,007 |
Loading, please wait
Year | Q1 | Q2 | Q3 | Q4 |
|---|---|---|---|---|
| 2010 | - | - | - | 1,230 |
| 2011 | 31 | 1,062 | 1,942 | 3,409 |
| 2012 | 2,795 | 2,090 | 2,232 | 3,062 |
| 2013 | 3,285 | 2,888 | 2,908 | 3,508 |
| 2014 | 3,389 | 4,068 | 3,518 | 3,915 |
| 2015 | 3,656 | 4,454 | 4,352 | 4,420 |
| 2016 | 4,517 | 4,530 | 4,336 | 4,490 |
| 2017 | 4,533 | 4,914 | 4,147 | 4,264 |
| 2018 | 3,768 | 4,480 | 4,051 | 4,603 |
| 2019 | 4,507 | 5,029 | 6,140 | 4,346 |
| 2020 | 3,728 | 2,888 | 3,760 | 4,871 |
| 2021 | 4,074 | 5,298 | 1,925 | 75 |
| 2022 | 3 | 9 | 0 | 0 |
| 2023 | 0 | 0 | 0 | 0 |
| 2024 | 0 | 0 | 0 | 0 |
| 2025 | - | - | - | - |
| Total | 38,286 | 41,710 | 39,311 | 42,193 |
Loading, please wait
Year | Sales |
|---|---|
| 2022 | 12 |
| 2021 | 11,372 |
| 2020 | 15,247 |
| 2019 | 20,022 |
| 2018 | 16,902 |
| 2017 | 17,858 |
| 2016 | 17,873 |
| 2015 | 16,882 |
| 2014 | 14,890 |
| 2013 | 12,589 |
| 2012 | 10,179 |
| 2011 | 6,444 |
| 2010 | 1,230 |
| Total | 161,500 |
Download Historic Sales Data
Embedded Code
See more widgetsSources: Manufacturers