Key Stats
How many Titan did Nissan sell in 2024?
Nissan sold 10,875 Titan in 2024. In 2023, Nissan sold 15,889 Titan. They sold 5,014 more units in year 2023 compared to 2024 with a percent loss of 31.56% YoY.
Overview
The Nissan Titan is a Extended Cab Pickup with room for 6 people.
How Much Does the 2020 Nissan Titan Cost?
The 2020 Nissan Titan starts at $36,190 MSRP. Fully loaded, the Nissan Titan will cost you about $58,690.
Nissan Titan Engine, Transmission, and Performance Numbers
Nissan Titan is powered by a 5.6-liter V-8 engine with a RWD powertrain that makes 400 -hp and torque. The transmission on the Nissan Titan is an.
2020 Nissan Titan Fuel Economy
The 2020 Nissan Titan has a rating of 17 mpg combined.
Nissan Titan United States Sale figures by year, quarter, and month are presented below. Including the most up to date sales data for the Nissan Titan. See how the Nissan Titan stacks up the other models in the Large Pickup Trucks, Pickup Trucks segments.
Year | Jan | Feb | Mar | Apr | May | Jun | Jul | Aug | Sep | Oct | Nov | Dec |
|---|---|---|---|---|---|---|---|---|---|---|---|---|
| 2005 | 6,559 | 6,894 | 8,202 | 7,387 | 7,441 | 7,565 | 9,114 | 7,428 | 7,015 | 6,103 | 5,958 | 7,279 |
| 2006 | 5,940 | 7,009 | 8,328 | 6,425 | 5,713 | 5,422 | 5,691 | 5,650 | 6,073 | 5,499 | 4,867 | 5,575 |
| 2007 | 5,223 | 6,058 | 7,563 | 4,922 | 4,899 | 4,405 | 5,708 | 6,985 | 5,193 | 5,001 | 5,001 | 4,785 |
| 2008 | 3,692 | 3,794 | 3,869 | 2,407 | 2,163 | 1,260 | 3,972 | 5,871 | 2,872 | 1,007 | 1,022 | 2,124 |
| 2009 | 1,458 | 1,508 | 1,616 | 1,309 | 1,623 | 1,290 | 1,467 | 1,534 | 1,900 | 1,688 | 1,501 | 2,148 |
| 2010 | 1,492 | 1,721 | 2,456 | 1,784 | 2,063 | 1,604 | 2,139 | 2,141 | 2,063 | 1,964 | 1,796 | 2,193 |
| 2011 | 1,431 | 1,467 | 1,920 | 1,253 | 1,160 | 1,647 | 1,821 | 2,355 | 2,294 | 2,114 | 2,146 | 2,386 |
| 2012 | 1,306 | 1,576 | 1,731 | 1,568 | 2,166 | 2,332 | 2,028 | 1,907 | 1,792 | 1,582 | 1,750 | 1,838 |
| 2013 | 1,394 | 1,634 | 2,084 | 1,038 | 1,402 | 1,300 | 1,168 | 1,261 | 962 | 984 | 1,180 | 1,284 |
| 2014 | 887 | 1,117 | 1,314 | 956 | 1,166 | 976 | 1,072 | 1,231 | 977 | 990 | 972 | 869 |
| 2015 | 774 | 816 | 1,048 | 1,038 | 1,218 | 1,155 | 1,126 | 1,268 | 1,078 | 882 | 719 | 1,018 |
| 2016 | 937 | 1,060 | 1,274 | 1,010 | 922 | 896 | 1,143 | 1,248 | 2,484 | 3,181 | 3,329 | 4,396 |
| 2017 | 2,768 | 2,988 | 5,539 | 4,033 | 4,937 | 4,199 | 3,791 | 3,521 | 3,773 | 4,114 | 7,679 | 5,582 |
| 2018 | 4,051 | 3,761 | 4,912 | 2,670 | 3,779 | 4,121 | 3,977 | 4,661 | 5,907 | 4,114 | 3,845 | 4,661 |
| 2019 | 3,031 | 2,722 | 3,930 | 2,489 | 3,189 | 2,665 | 2,242 | 2,589 | 2,555 | 2,134 | 2,052 | 1,916 |
| Total | 40,943 | 44,125 | 55,786 | 40,289 | 43,841 | 40,837 | 46,459 | 49,650 | 46,938 | 41,357 | 43,817 | 48,054 |
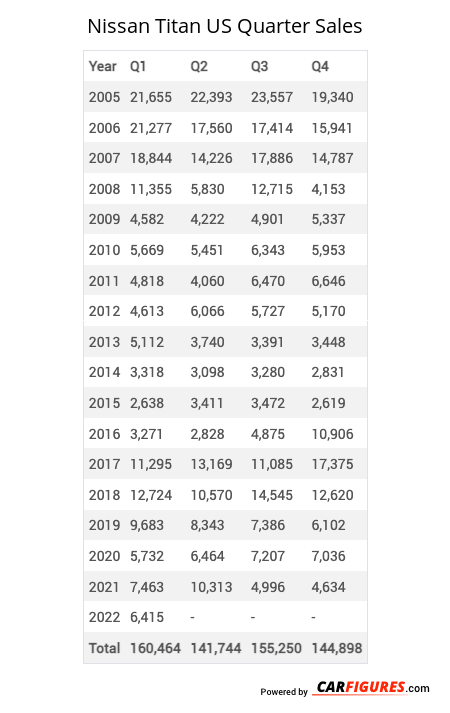
Year | Q1 | Q2 | Q3 | Q4 |
|---|---|---|---|---|
| 2005 | 21,655 | 22,393 | 23,557 | 19,340 |
| 2006 | 21,277 | 17,560 | 17,414 | 15,941 |
| 2007 | 18,844 | 14,226 | 17,886 | 14,787 |
| 2008 | 11,355 | 5,830 | 12,715 | 4,153 |
| 2009 | 4,582 | 4,222 | 4,901 | 5,337 |
| 2010 | 5,669 | 5,451 | 6,343 | 5,953 |
| 2011 | 4,818 | 4,060 | 6,470 | 6,646 |
| 2012 | 4,613 | 6,066 | 5,727 | 5,170 |
| 2013 | 5,112 | 3,740 | 3,391 | 3,448 |
| 2014 | 3,318 | 3,098 | 3,280 | 2,831 |
| 2015 | 2,638 | 3,411 | 3,472 | 2,619 |
| 2016 | 3,271 | 2,828 | 4,875 | 10,906 |
| 2017 | 11,295 | 13,169 | 11,085 | 17,375 |
| 2018 | 12,724 | 10,570 | 14,545 | 12,620 |
| 2019 | 9,683 | 8,343 | 7,386 | 6,102 |
| 2020 | 5,732 | 6,464 | 7,207 | 7,036 |
| 2021 | 7,463 | 10,313 | 4,996 | 4,634 |
| 2022 | 6,415 | 4,797 | 1,276 | 2,576 |
| 2023 | 4,038 | 6,512 | 1,557 | 3,782 |
| 2024 | 4,144 | 4,063 | 2,668 | 0 |
| 2025 | - | - | - | - |
| Total | 168,646 | 157,116 | 160,751 | 151,256 |
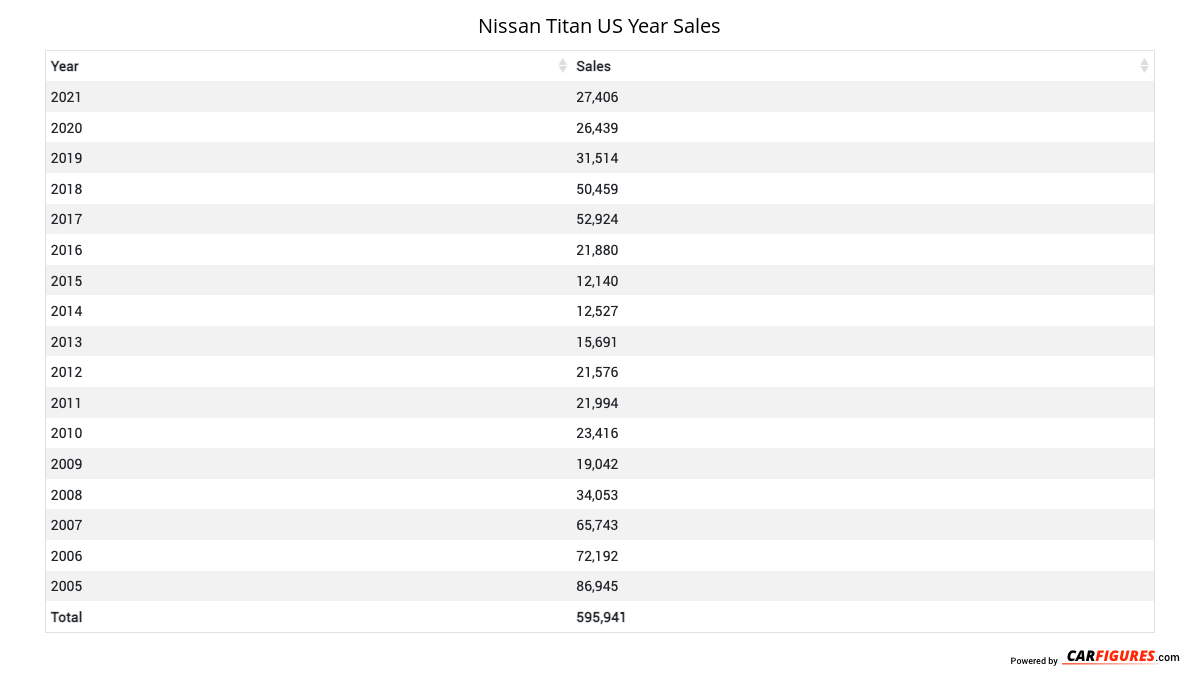
Year | Sales |
|---|---|
| 2024 | 10,875 |
| 2023 | 15,889 |
| 2022 | 15,064 |
| 2021 | 27,406 |
| 2020 | 26,439 |
| 2019 | 31,514 |
| 2018 | 50,459 |
| 2017 | 52,924 |
| 2016 | 21,880 |
| 2015 | 12,140 |
| 2014 | 12,527 |
| 2013 | 15,691 |
| 2012 | 21,576 |
| 2011 | 21,994 |
| 2010 | 23,416 |
| 2009 | 19,042 |
| 2008 | 34,053 |
| 2007 | 65,743 |
| 2006 | 72,192 |
| 2005 | 86,945 |
| Total | 637,769 |
Download Historic Sales Data

Embedded Code
See more widgetsSources: Manufacturers