Last updated: January 03, 2025

Overview
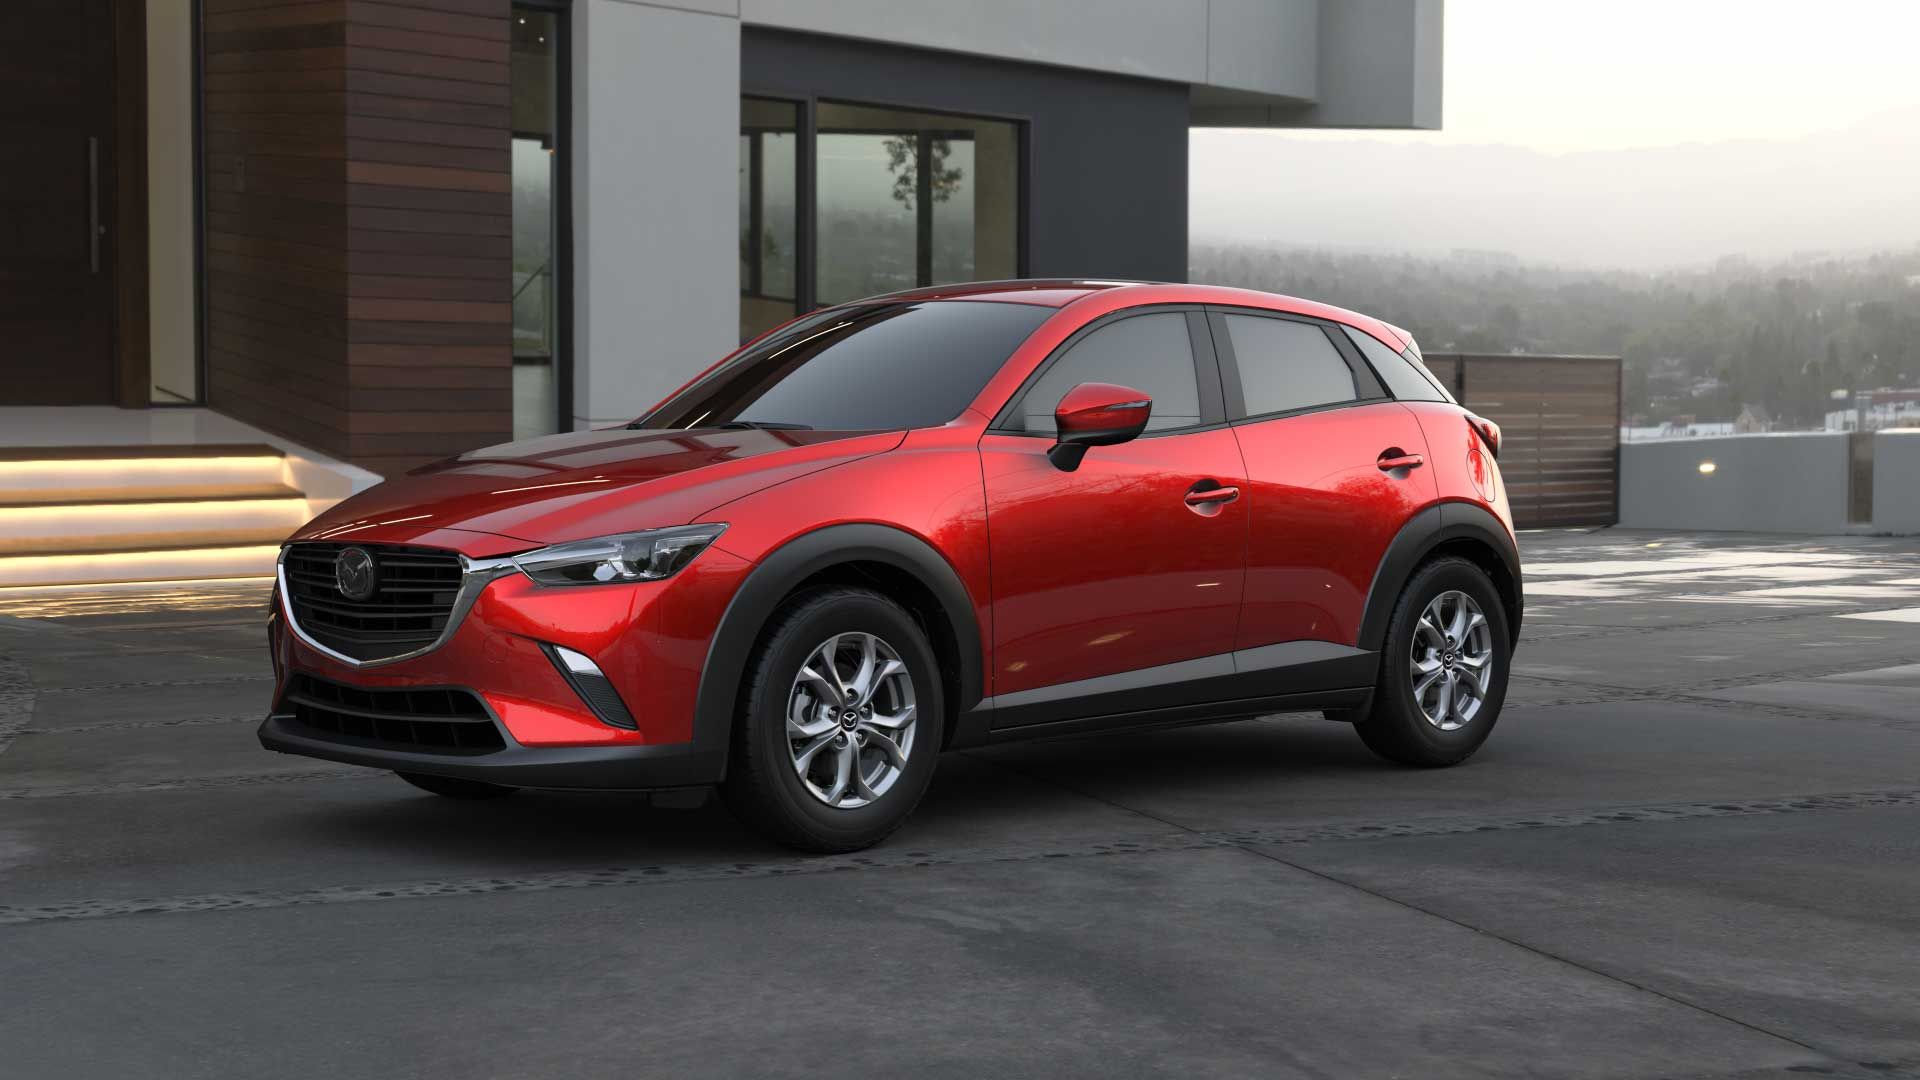
The Mazda CX-3 is a SUV with room for 5 people from automaker Mazda.
How Much Does the 2020 Mazda CX-3 Cost?
Pricing for the 2020 Mazda CX-3 starts at $20,640 MSRP and goes up to $22,040 fully loaded.
Mazda CX-3 Engine, Transmission, and Performance Numbers
Mazda CX-3 is powered by a 2.0-liter I-4 engine with a FWD powertrain that makes 148 -hp and torque. The transmission on the Mazda CX-3 is an.
2020 Mazda CX-3 Fuel Economy
The 2020 Mazda CX-3 is expected to get 31 mpg combined.
List of Mazda CX-3 Competitors
Some of Mazda CX-3 competitors include the Hyundai Kona, Kia Soul and Honda HR-V.
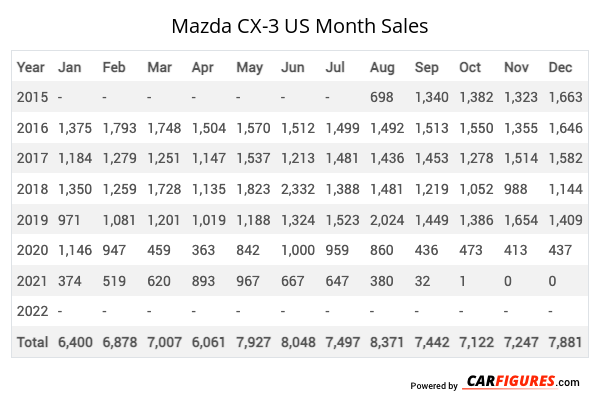
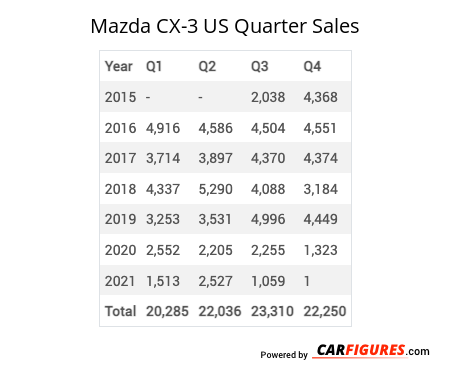
Mazda CX-3 United States Sale figures by year, quarter, and month are presented below. Including the most up to date sales data for the Mazda CX-3. See how the Mazda CX-3 stacks up the other models in the Crossover/SUVS, Subcompact Crossover/SUVs segments.
For sales numbers of the Mazda CX-3 in Canada, click here.
Loading, please wait
Year | Jan | Feb | Mar | Apr | May | Jun | Jul | Aug | Sep | Oct | Nov | Dec |
|---|---|---|---|---|---|---|---|---|---|---|---|---|
| 2015 | - | - | - | - | - | - | - | 698 | 1,340 | 1,382 | 1,323 | 1,663 |
| 2016 | 1,375 | 1,793 | 1,748 | 1,504 | 1,570 | 1,512 | 1,499 | 1,492 | 1,513 | 1,550 | 1,355 | 1,646 |
| 2017 | 1,184 | 1,279 | 1,251 | 1,147 | 1,537 | 1,213 | 1,481 | 1,436 | 1,453 | 1,278 | 1,514 | 1,582 |
| 2018 | 1,350 | 1,259 | 1,728 | 1,135 | 1,823 | 2,332 | 1,388 | 1,481 | 1,219 | 1,052 | 988 | 1,144 |
| 2019 | 971 | 1,081 | 1,201 | 1,019 | 1,188 | 1,324 | 1,523 | 2,024 | 1,449 | 1,386 | 1,654 | 1,409 |
| 2020 | 1,146 | 947 | 459 | 363 | 842 | 1,000 | 959 | 860 | 436 | 473 | 413 | 437 |
| 2021 | 374 | 519 | 620 | 893 | 967 | 667 | 647 | 380 | 32 | 1 | 0 | 0 |
| 2022 | 0 | 0 | 0 | 0 | 0 | 0 | 0 | 0 | 0 | 0 | 0 | 0 |
| 2023 | 0 | 0 | 0 | 0 | 0 | 0 | 0 | 0 | 0 | 0 | 0 | 0 |
| 2024 | 0 | 0 | 0 | 0 | 0 | 0 | 0 | 0 | 0 | 0 | 0 | 0 |
| 2025 | - | - | - | - | - | - | - | - | - | - | - | - |
| Total | 6,400 | 6,878 | 7,007 | 6,061 | 7,927 | 8,048 | 7,497 | 8,371 | 7,442 | 7,122 | 7,247 | 7,881 |
Loading, please wait
Year | Q1 | Q2 | Q3 | Q4 |
|---|---|---|---|---|
| 2015 | - | - | 2,038 | 4,368 |
| 2016 | 4,916 | 4,586 | 4,504 | 4,551 |
| 2017 | 3,714 | 3,897 | 4,370 | 4,374 |
| 2018 | 4,337 | 5,290 | 4,088 | 3,184 |
| 2019 | 3,253 | 3,531 | 4,996 | 4,449 |
| 2020 | 2,552 | 2,205 | 2,255 | 1,323 |
| 2021 | 1,513 | 2,527 | 1,059 | 1 |
| 2022 | 0 | 0 | 0 | 0 |
| 2023 | 0 | 0 | 0 | 0 |
| 2024 | 0 | 0 | 0 | 0 |
| 2025 | - | - | - | - |
| Total | 20,285 | 22,036 | 23,310 | 22,250 |
Loading, please wait
Year | Sales |
|---|---|
| 2021 | 5,100 |
| 2020 | 8,335 |
| 2019 | 16,229 |
| 2018 | 16,899 |
| 2017 | 16,355 |
| 2016 | 18,557 |
| 2015 | 6,406 |
| Total | 87,881 |
Download Historic Sales Data
Looking for more data/visualizations? Send us an email at contact@carfigures.com for customized data aggregates and visualizations.Embedded Code
See more widgetsSources: Manufacturers


