

Key Stats
How many Kona did Hyundai sell in 2025?
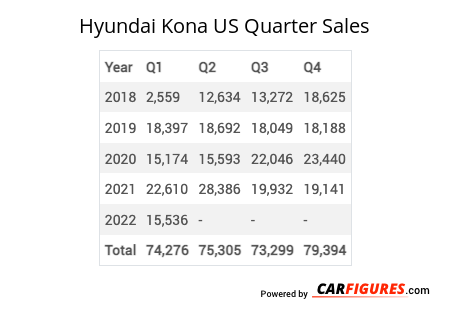
Hyundai sold 12,653 Kona in 2025. (From Jan - Mar 2025)
How many Kona did Hyundai sell in March 2025?
Hyundai sold 7,024 Kona in March 2025.
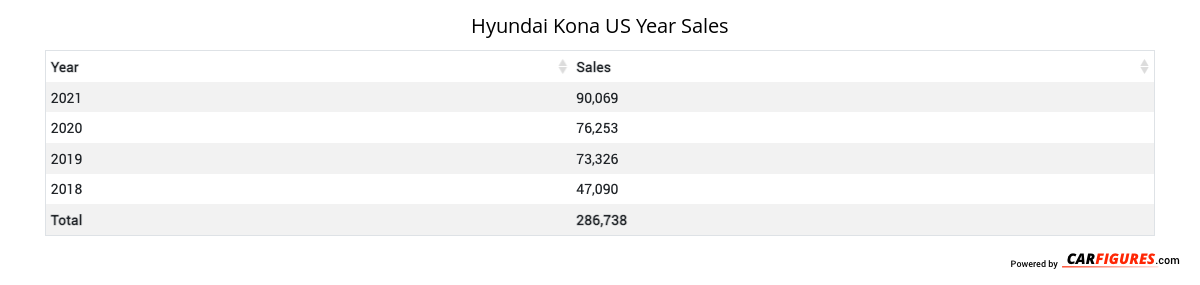
How many Kona did Hyundai sell in 2024?
Hyundai sold 82,172 Kona in 2024. In 2023, Hyundai sold 79,116 Kona. They sold 3,056 more units in 2024 compared to 2023 with a percent gain of 3.86% YoY.
Overview
The 2024 Hyundai Kona is a vehicle from automaker Hyundai.
How Much Does the 2024 Hyundai Kona Cost?
The 2024 Hyundai Kona starts at $24,100 MSRP. Fully loaded, the Hyundai Kona will cost you about $33,150.
Hyundai Kona Engine, Transmission, and Performance Numbers
Hyundai Kona includes a 2.0-liter engine combined with a Intelligent Variable (IVT). This delivers 147 hp with 132 lb-ft torque delivered through a Front Wheel Drive drivetrain.
List of Hyundai Kona Competitors
Some of Hyundai Kona competitors include the Honda HR-V, Kia Soul and Subaru CrossTrek.
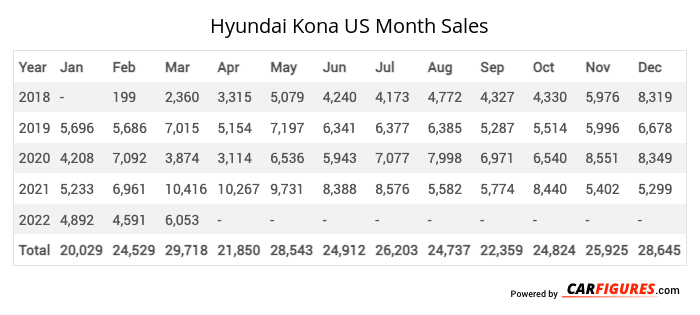
Hyundai Kona United States Sale figures by year, quarter, and month are presented below. Including the most up to date sales data for the Hyundai Kona. See how the Hyundai Kona stacks up the other models in the Crossover/SUVS, Subcompact Crossover/SUVs segments.
Year | Jan | Feb | Mar | Apr | May | Jun | Jul | Aug | Sep | Oct | Nov | Dec |
|---|---|---|---|---|---|---|---|---|---|---|---|---|
| 2018 | - | 199 | 2,360 | 3,315 | 5,079 | 4,240 | 4,173 | 4,772 | 4,327 | 4,330 | 5,976 | 8,319 |
| 2019 | 5,696 | 5,686 | 7,015 | 5,154 | 7,197 | 6,341 | 6,377 | 6,385 | 5,287 | 5,514 | 5,996 | 6,678 |
| 2020 | 4,208 | 7,092 | 3,874 | 3,114 | 6,536 | 5,943 | 7,077 | 7,998 | 6,971 | 6,540 | 8,551 | 8,349 |
| 2021 | 5,233 | 6,961 | 10,416 | 10,267 | 9,731 | 8,388 | 8,576 | 5,582 | 5,774 | 8,440 | 5,402 | 5,299 |
| 2022 | 4,892 | 4,591 | 6,053 | 5,485 | 5,665 | 6,101 | 4,253 | 3,388 | 5,252 | 5,780 | 5,562 | 6,972 |
| 2023 | 5,826 | 6,080 | 7,314 | 6,831 | 5,613 | 6,261 | 6,123 | 5,777 | 6,693 | 7,927 | 6,991 | 7,680 |
| 2024 | 6,577 | 7,024 | 9,453 | 8,273 | 8,308 | 6,904 | 6,713 | 6,112 | 5,144 | 5,685 | 6,133 | 5,846 |
| 2025 | - | 5,629 | 7,024 | - | - | - | - | - | - | - | - | - |
| Total | 32,432 | 43,262 | 53,509 | 42,439 | 48,129 | 44,178 | 43,292 | 40,014 | 39,448 | 44,216 | 44,611 | 49,143 |
Year | Q1 | Q2 | Q3 | Q4 |
|---|---|---|---|---|
| 2018 | 2,559 | 12,634 | 13,272 | 18,625 |
| 2019 | 18,397 | 18,692 | 18,049 | 18,188 |
| 2020 | 15,174 | 15,593 | 22,046 | 23,440 |
| 2021 | 22,610 | 28,386 | 19,932 | 19,141 |
| 2022 | 15,536 | 17,251 | 12,893 | 18,314 |
| 2023 | 19,220 | 18,705 | 18,593 | 22,598 |
| 2024 | 23,054 | 23,485 | 17,969 | 17,664 |
| 2025 | 12,653 | - | - | - |
| Total | 129,203 | 134,746 | 122,754 | 137,970 |
Year | Sales |
|---|---|
| 2024 | 82,172 |
| 2023 | 79,116 |
| 2022 | 63,994 |
| 2021 | 90,069 |
| 2020 | 76,253 |
| 2019 | 73,326 |
| 2018 | 47,090 |
| Total | 512,020 |
Download Historic Sales Data
Embedded Code
See more widgetsSources: Manufacturers