

Key Stats
How many G90 did Genesis sell in 2025?
Genesis sold 423 G90 in 2025. (From Jan - Mar 2025)
How many G90 did Genesis sell in March 2025?
Genesis sold 99 G90 in March 2025.
How many G90 did Genesis sell in 2024?
Genesis sold 1,503 G90 in 2024. In 2023, Genesis sold 1,288 G90. They sold 215 more units in 2024 compared to 2023 with a percent gain of 16.69% YoY.
Overview
The 2022 Genesis G90 is a vehicle from automaker Genesis.
How Much Does the 2022 Genesis G90 Cost?
Pricing for the 2022 Genesis G90 starts at $73,950 MSRP and goes up to $80,200 fully loaded.
Genesis G90 Engine, Transmission, and Performance Numbers
Genesis G90 is powered by a 3.3-liter engine with a Rear Wheel Drive powertrain that makes 365 -hp and 376 lb-ft torque. The transmission on the Genesis G90 is an 8-Speed Automatic.
List of Genesis G90 Competitors
Some of Genesis G90 competitors include the Lincoln Continental and Cadillac CT6.
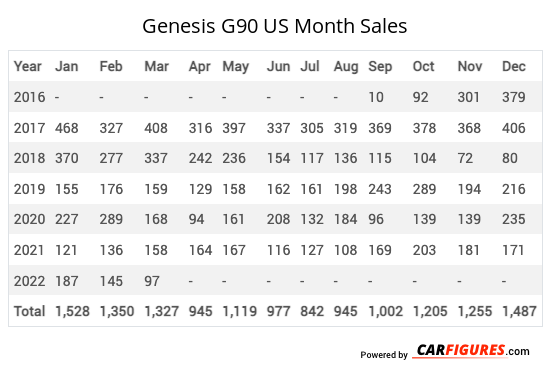
Genesis G90 United States Sale figures by year, quarter, and month are presented below. Including the most up to date sales data for the Genesis G90. See how the Genesis G90 stacks up the other models in the Cars, Premium Large Cars segments.
Year | Jan | Feb | Mar | Apr | May | Jun | Jul | Aug | Sep | Oct | Nov | Dec |
|---|---|---|---|---|---|---|---|---|---|---|---|---|
| 2016 | - | - | - | - | - | - | - | - | 10 | 92 | 301 | 379 |
| 2017 | 468 | 327 | 408 | 316 | 397 | 337 | 305 | 319 | 369 | 378 | 368 | 406 |
| 2018 | 370 | 277 | 337 | 242 | 236 | 154 | 117 | 136 | 115 | 104 | 72 | 80 |
| 2019 | 155 | 176 | 159 | 129 | 158 | 162 | 161 | 198 | 243 | 289 | 194 | 216 |
| 2020 | 227 | 289 | 168 | 94 | 161 | 208 | 132 | 184 | 96 | 139 | 139 | 235 |
| 2021 | 121 | 136 | 158 | 164 | 167 | 116 | 127 | 108 | 169 | 203 | 181 | 171 |
| 2022 | 187 | 145 | 97 | 48 | 48 | 21 | 22 | 80 | 104 | 103 | 150 | 133 |
| 2023 | 105 | 111 | 140 | 120 | 113 | 114 | 108 | 119 | 92 | 68 | 68 | 130 |
| 2024 | 202 | 100 | 140 | 75 | 95 | 85 | 112 | 118 | 90 | 178 | 150 | 158 |
| 2025 | 202 | 122 | 99 | - | - | - | - | - | - | - | - | - |
| Total | 2,037 | 1,683 | 1,706 | 1,188 | 1,375 | 1,197 | 1,084 | 1,262 | 1,288 | 1,554 | 1,623 | 1,908 |
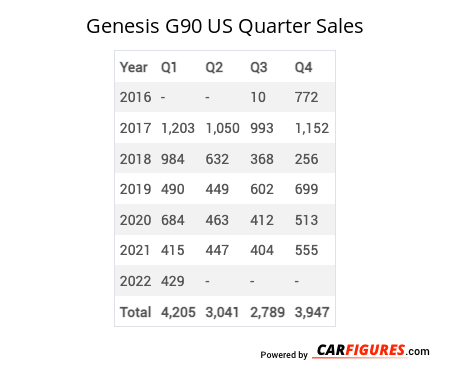
Year | Q1 | Q2 | Q3 | Q4 |
|---|---|---|---|---|
| 2016 | - | - | 10 | 772 |
| 2017 | 1,203 | 1,050 | 993 | 1,152 |
| 2018 | 984 | 632 | 368 | 256 |
| 2019 | 490 | 449 | 602 | 699 |
| 2020 | 684 | 463 | 412 | 513 |
| 2021 | 415 | 447 | 404 | 555 |
| 2022 | 429 | 117 | 206 | 386 |
| 2023 | 356 | 347 | 319 | 266 |
| 2024 | 442 | 255 | 320 | 486 |
| 2025 | 423 | - | - | - |
| Total | 5,426 | 3,760 | 3,634 | 5,085 |
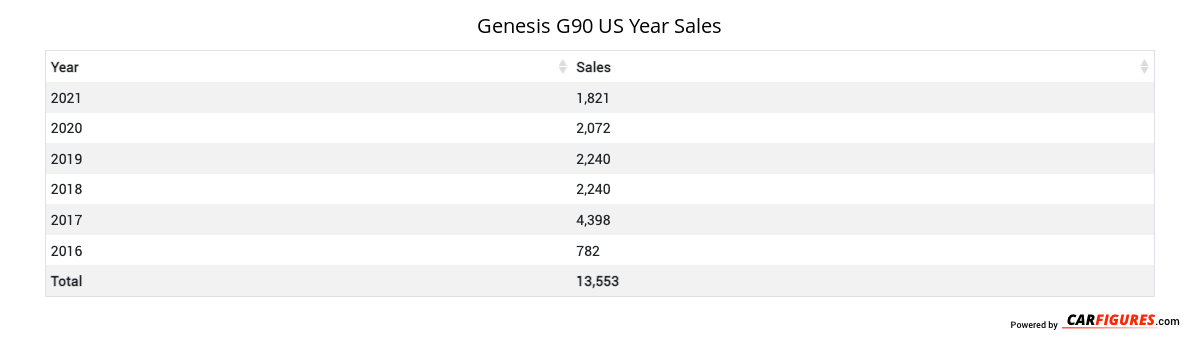
Year | Sales |
|---|---|
| 2024 | 1,503 |
| 2023 | 1,288 |
| 2022 | 1,138 |
| 2021 | 1,821 |
| 2020 | 2,072 |
| 2019 | 2,240 |
| 2018 | 2,240 |
| 2017 | 4,398 |
| 2016 | 782 |
| Total | 17,482 |
Download Historic Sales Data
Embedded Code
See more widgetsSources: Manufacturers