

Key Stats
How many Stinger did Kia sell in 2024?
Kia sold 1 Stinger in 2024. In 2023, Kia sold 5,215 Stinger. They sold 5,214 more units in year 2023 compared to 2024 with a percent loss of 99.98% YoY.
Overview
The 2022 Kia Stinger is a vehicle from automaker Kia.
How Much Does the 2022 Kia Stinger Cost?
Pricing for the 2022 Kia Stinger starts at $36,090 MSRP and goes up to $53,490 fully loaded.
Kia Stinger Engine, Transmission, and Performance Numbers
Kia Stinger includes a 2.5-liter engine combined with a Electronically Controlled 8-Spd Auto. This delivers 300 hp with 311 lb-ft torque delivered through a Rear Wheel Drive drivetrain.
List of Kia Stinger Competitors
Some of Kia Stinger competitors include the Ford Mustang and Genesis G70.
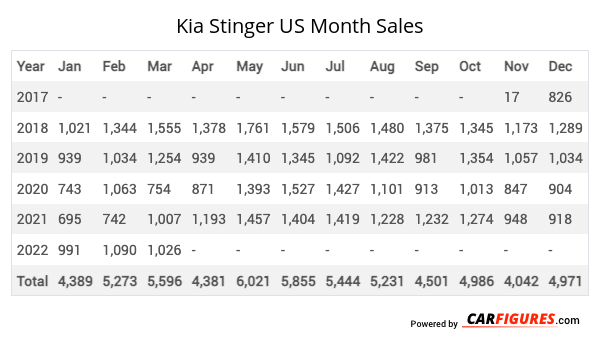
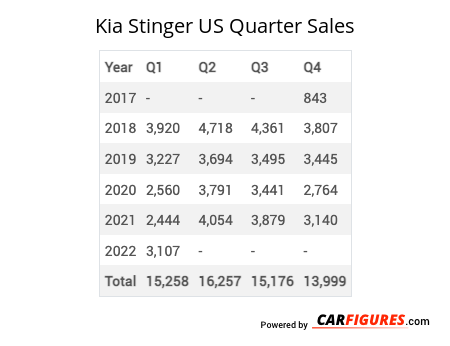
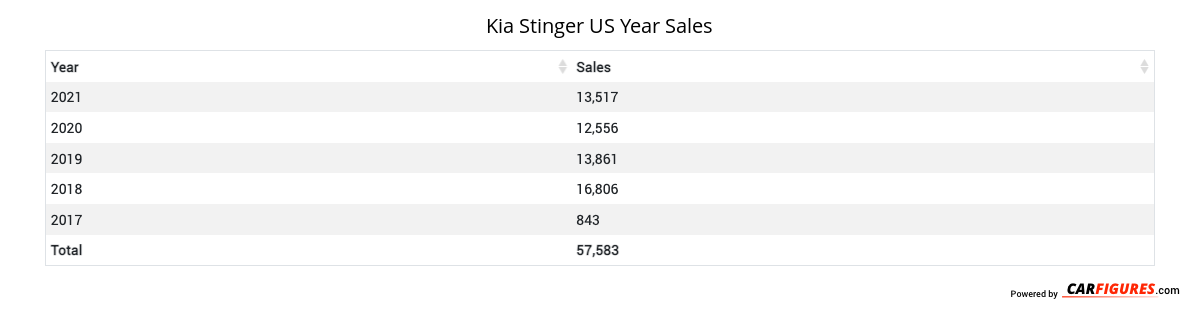
Kia Stinger United States Sale figures by year, quarter, and month are presented below. Including the most up to date sales data for the Kia Stinger. See how the Kia Stinger stacks up the other models in the Cars, Premium Midsize Cars segments.
Year | Jan | Feb | Mar | Apr | May | Jun | Jul | Aug | Sep | Oct | Nov | Dec |
|---|---|---|---|---|---|---|---|---|---|---|---|---|
| 2017 | - | - | - | - | - | - | - | - | - | - | 17 | 826 |
| 2018 | 1,021 | 1,344 | 1,555 | 1,378 | 1,761 | 1,579 | 1,506 | 1,480 | 1,375 | 1,345 | 1,173 | 1,289 |
| 2019 | 939 | 1,034 | 1,254 | 939 | 1,410 | 1,345 | 1,092 | 1,422 | 981 | 1,354 | 1,057 | 1,034 |
| 2020 | 743 | 1,063 | 754 | 871 | 1,393 | 1,527 | 1,427 | 1,101 | 913 | 1,013 | 847 | 904 |
| 2021 | 695 | 742 | 1,007 | 1,193 | 1,457 | 1,404 | 1,419 | 1,228 | 1,232 | 1,274 | 948 | 918 |
| 2022 | 991 | 1,090 | 1,026 | 895 | 448 | 713 | 513 | 513 | 454 | 430 | 342 | 394 |
| 2023 | 466 | 622 | 958 | 963 | 903 | 642 | 464 | 0 | 117 | 49 | 20 | 11 |
| 2024 | 0 | 0 | 1 | 0 | 0 | 0 | 0 | 0 | 0 | 0 | 0 | 0 |
| 2025 | - | - | - | - | - | - | - | - | - | - | - | - |
| Total | 4,855 | 5,895 | 6,555 | 6,239 | 7,372 | 7,210 | 6,421 | 5,744 | 5,072 | 5,465 | 4,404 | 5,376 |
Year | Q1 | Q2 | Q3 | Q4 |
|---|---|---|---|---|
| 2017 | - | - | - | 843 |
| 2018 | 3,920 | 4,718 | 4,361 | 3,807 |
| 2019 | 3,227 | 3,694 | 3,495 | 3,445 |
| 2020 | 2,560 | 3,791 | 3,441 | 2,764 |
| 2021 | 2,444 | 4,054 | 3,879 | 3,140 |
| 2022 | 3,107 | 2,056 | 1,480 | 1,166 |
| 2023 | 2,046 | 2,508 | 581 | 80 |
| 2024 | 1 | 0 | 0 | 0 |
| 2025 | - | - | - | - |
| Total | 17,305 | 20,821 | 17,237 | 15,245 |
Year | Sales |
|---|---|
| 2024 | 1 |
| 2023 | 5,215 |
| 2022 | 7,809 |
| 2021 | 13,517 |
| 2020 | 12,556 |
| 2019 | 13,861 |
| 2018 | 16,806 |
| 2017 | 843 |
| Total | 70,608 |
Download Historic Sales Data
Embedded Code
See more widgetsSources: Manufacturers