Overview
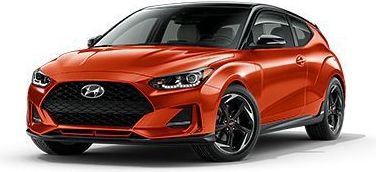
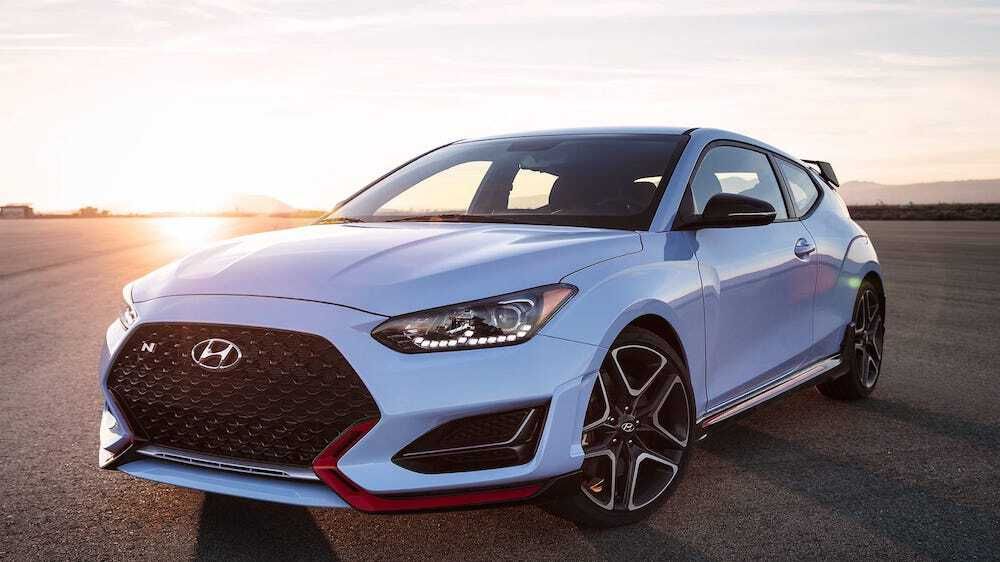
The Hyundai Veloster is a Hatchback with room for 4 people from automaker Hyundai.
How Much Does the 2021 Hyundai Veloster Cost?
Pricing for the 2021 Hyundai Veloster starts at $18,900 MSRP and goes up to $28,450 fully loaded.
Hyundai Veloster Engine, Transmission, and Performance Numbers
Hyundai Veloster is powered by a 2.0-liter I-4 engine with a FWD powertrain that makes 147 -hp and torque. The transmission on the Hyundai Veloster is an.
2021 Hyundai Veloster Fuel Economy
The 2021 Hyundai Veloster is expected to get 28 mpg combined.
List of Hyundai Veloster Competitors
Some of Hyundai Veloster competitors include the Mazda 3 and Honda Civic.
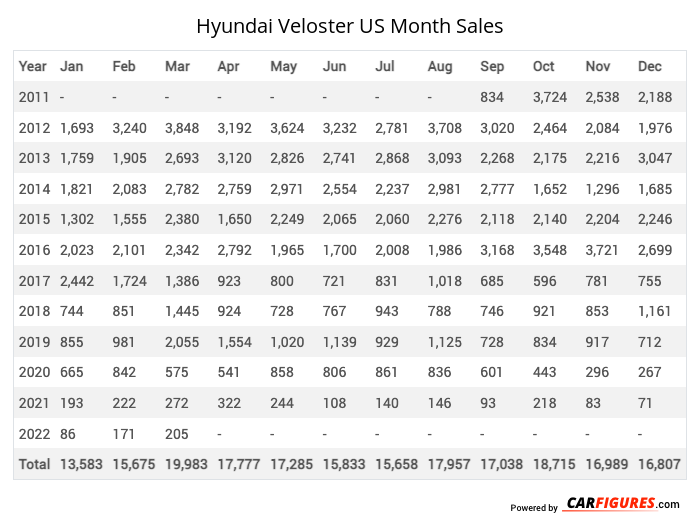
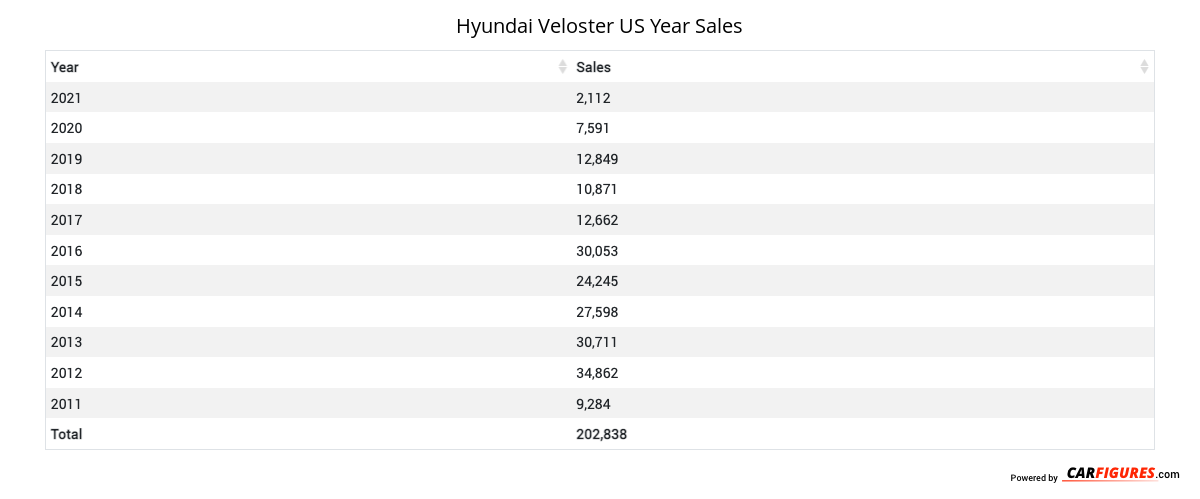
Hyundai Veloster United States Sale figures by year, quarter, and month are presented below. Including the most up to date sales data for the Hyundai Veloster. See how the Hyundai Veloster stacks up the other models in the Cars, Sport/Performance Cars segments.
Year | Jan | Feb | Mar | Apr | May | Jun | Jul | Aug | Sep | Oct | Nov | Dec |
|---|---|---|---|---|---|---|---|---|---|---|---|---|
| 2011 | - | - | - | - | - | - | - | - | 834 | 3,724 | 2,538 | 2,188 |
| 2012 | 1,693 | 3,240 | 3,848 | 3,192 | 3,624 | 3,232 | 2,781 | 3,708 | 3,020 | 2,464 | 2,084 | 1,976 |
| 2013 | 1,759 | 1,905 | 2,693 | 3,120 | 2,826 | 2,741 | 2,868 | 3,093 | 2,268 | 2,175 | 2,216 | 3,047 |
| 2014 | 1,821 | 2,083 | 2,782 | 2,759 | 2,971 | 2,554 | 2,237 | 2,981 | 2,777 | 1,652 | 1,296 | 1,685 |
| 2015 | 1,302 | 1,555 | 2,380 | 1,650 | 2,249 | 2,065 | 2,060 | 2,276 | 2,118 | 2,140 | 2,204 | 2,246 |
| 2016 | 2,023 | 2,101 | 2,342 | 2,792 | 1,965 | 1,700 | 2,008 | 1,986 | 3,168 | 3,548 | 3,721 | 2,699 |
| 2017 | 2,442 | 1,724 | 1,386 | 923 | 800 | 721 | 831 | 1,018 | 685 | 596 | 781 | 755 |
| 2018 | 744 | 851 | 1,445 | 924 | 728 | 767 | 943 | 788 | 746 | 921 | 853 | 1,161 |
| 2019 | 855 | 981 | 2,055 | 1,554 | 1,020 | 1,139 | 929 | 1,125 | 728 | 834 | 917 | 712 |
| 2020 | 665 | 842 | 575 | 541 | 858 | 806 | 861 | 836 | 601 | 443 | 296 | 267 |
| 2021 | 193 | 222 | 272 | 322 | 244 | 108 | 140 | 146 | 93 | 218 | 83 | 71 |
| 2022 | 86 | 171 | 205 | 279 | 191 | 197 | 174 | 281 | 209 | 83 | 25 | 19 |
| 2023 | 3 | 1 | 1 | 1 | 0 | 0 | 0 | 0 | 0 | 0 | 0 | 0 |
| 2024 | 0 | 0 | 0 | 0 | 0 | 0 | 0 | 0 | 0 | 0 | 0 | 0 |
| 2025 | - | - | - | - | - | - | - | - | - | - | - | - |
| Total | 13,586 | 15,676 | 19,984 | 18,057 | 17,476 | 16,030 | 15,832 | 18,238 | 17,247 | 18,798 | 17,014 | 16,826 |
Year | Q1 | Q2 | Q3 | Q4 |
|---|---|---|---|---|
| 2011 | - | - | 834 | 8,450 |
| 2012 | 8,781 | 10,048 | 9,509 | 6,524 |
| 2013 | 6,357 | 8,687 | 8,229 | 7,438 |
| 2014 | 6,686 | 8,284 | 7,995 | 4,633 |
| 2015 | 5,237 | 5,964 | 6,454 | 6,590 |
| 2016 | 6,466 | 6,457 | 7,162 | 9,968 |
| 2017 | 5,552 | 2,444 | 2,534 | 2,132 |
| 2018 | 3,040 | 2,419 | 2,477 | 2,935 |
| 2019 | 3,891 | 3,713 | 2,782 | 2,463 |
| 2020 | 2,082 | 2,205 | 2,298 | 1,006 |
| 2021 | 687 | 674 | 379 | 372 |
| 2022 | 462 | 667 | 664 | 127 |
| 2023 | 5 | 1 | 0 | 0 |
| 2024 | 0 | 0 | 0 | 0 |
| 2025 | - | - | - | - |
| Total | 49,246 | 51,563 | 51,317 | 52,638 |
Year | Sales |
|---|---|
| 2023 | 6 |
| 2022 | 1,920 |
| 2021 | 2,112 |
| 2020 | 7,591 |
| 2019 | 12,849 |
| 2018 | 10,871 |
| 2017 | 12,662 |
| 2016 | 30,053 |
| 2015 | 24,245 |
| 2014 | 27,598 |
| 2013 | 30,711 |
| 2012 | 34,862 |
| 2011 | 9,284 |
| Total | 204,764 |
Download Historic Sales Data
Looking for more data/visualizations? Send us an email at contact@carfigures.com for customized data aggregates and visualizations.Embedded Code
See more widgetsSources: Manufacturers

