Key Stats
How many Venue did Hyundai sell in 2025?
Hyundai sold 4,463 Venue in 2025. (From Jan - Mar 2025)
How many Venue did Hyundai sell in March 2025?
Hyundai sold 2,634 Venue in March 2025.
How many Venue did Hyundai sell in 2024?
Hyundai sold 24,607 Venue in 2024. In 2023, Hyundai sold 28,009 Venue. They sold 3,402 more units in year 2023 compared to 2024 with a percent loss of 12.15% YoY.
Overview
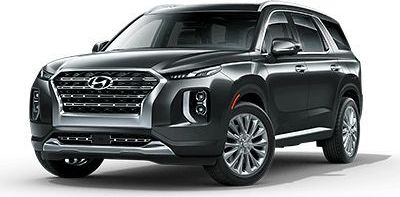
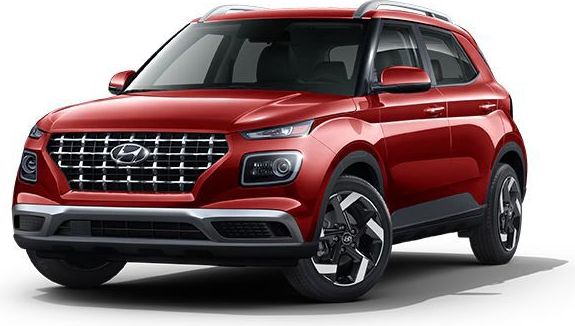
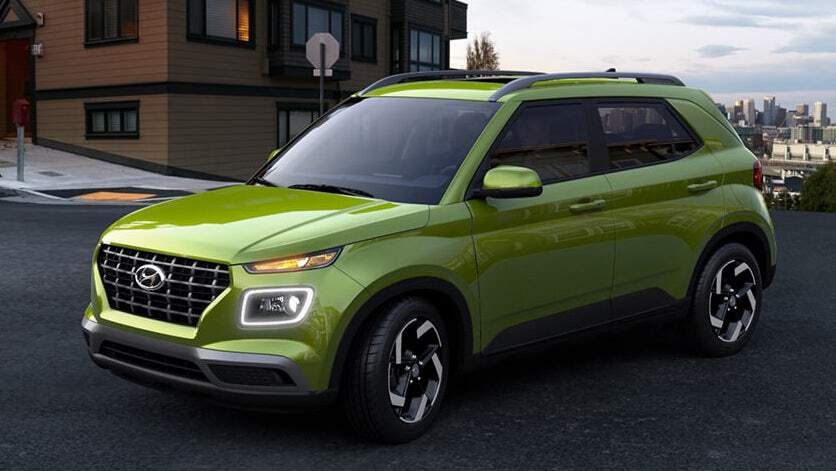
The 2022 Hyundai Venue is a vehicle from automaker Hyundai.
How Much Does the 2022 Hyundai Venue Cost?
The 2022 Hyundai Venue starts at $18,900 MSRP. Fully loaded, the Hyundai Venue will cost you about $22,150.
Hyundai Venue Engine, Transmission, and Performance Numbers
Hyundai Venue is powered by a 1.6-liter engine with a Front Wheel Drive powertrain that makes 121 -hp and 113 lb-ft torque. The transmission on the Hyundai Venue is an Intelligent Variable (IVT).
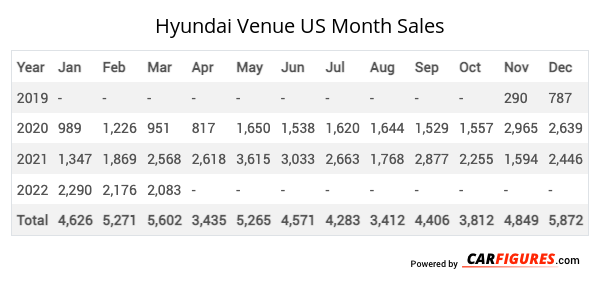
Hyundai Venue United States Sale figures by year, quarter, and month are presented below. Including the most up to date sales data for the Hyundai Venue. See how the Hyundai Venue stacks up the other models in the Crossover/SUVS, Subcompact Crossover/SUVs segments.
Year | Jan | Feb | Mar | Apr | May | Jun | Jul | Aug | Sep | Oct | Nov | Dec |
|---|---|---|---|---|---|---|---|---|---|---|---|---|
| 2019 | - | - | - | - | - | - | - | - | - | - | 290 | 787 |
| 2020 | 989 | 1,226 | 951 | 817 | 1,650 | 1,538 | 1,620 | 1,644 | 1,529 | 1,557 | 2,965 | 2,639 |
| 2021 | 1,347 | 1,869 | 2,568 | 2,618 | 3,615 | 3,033 | 2,663 | 1,768 | 2,877 | 2,255 | 1,594 | 2,446 |
| 2022 | 2,290 | 2,176 | 2,083 | 279 | 2,332 | 1,988 | 1,895 | 2,952 | 2,107 | 1,465 | 2,617 | 3,407 |
| 2023 | 2,441 | 2,537 | 3,625 | 2,648 | 2,413 | 2,695 | 2,581 | 2,197 | 1,732 | 1,757 | 1,716 | 1,667 |
| 2024 | 1,435 | 1,959 | 2,538 | 2,401 | 2,494 | 2,544 | 2,400 | 2,470 | 1,602 | 1,444 | 1,521 | 1,799 |
| 2025 | - | 1,829 | 2,634 | - | - | - | - | - | - | - | - | - |
| Total | 8,502 | 11,596 | 14,399 | 8,763 | 12,504 | 11,798 | 11,159 | 11,031 | 9,847 | 8,478 | 10,703 | 12,745 |
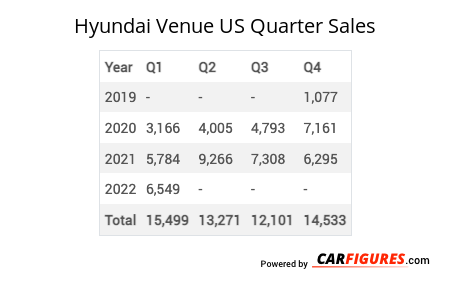
Year | Q1 | Q2 | Q3 | Q4 |
|---|---|---|---|---|
| 2019 | - | - | - | 1,077 |
| 2020 | 3,166 | 4,005 | 4,793 | 7,161 |
| 2021 | 5,784 | 9,266 | 7,308 | 6,295 |
| 2022 | 6,549 | 4,599 | 6,954 | 7,489 |
| 2023 | 8,603 | 7,756 | 6,510 | 5,140 |
| 2024 | 5,932 | 7,439 | 6,472 | 4,764 |
| 2025 | 4,463 | - | - | - |
| Total | 34,497 | 33,065 | 32,037 | 31,926 |
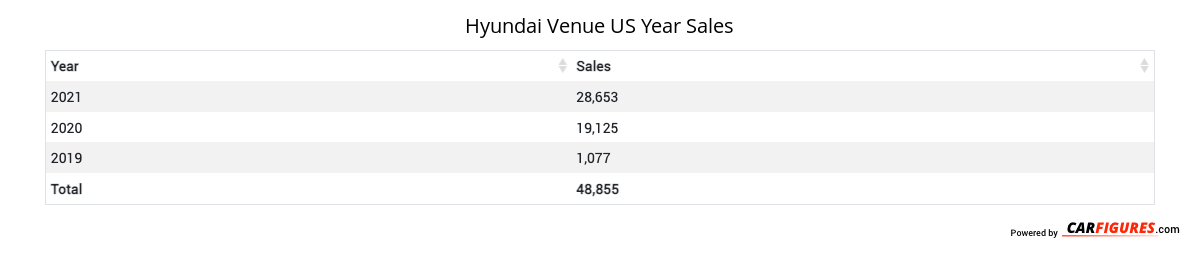
Year | Sales |
|---|---|
| 2024 | 24,607 |
| 2023 | 28,009 |
| 2022 | 25,591 |
| 2021 | 28,653 |
| 2020 | 19,125 |
| 2019 | 1,077 |
| Total | 127,062 |
Download Historic Sales Data
Embedded Code
See more widgetsSources: Manufacturers