Key Stats
How many Sonata did Hyundai sell in 2025?
Hyundai sold 11,040 Sonata in 2025. (From Jan - Mar 2025)
How many Sonata did Hyundai sell in March 2025?
Hyundai sold 5,706 Sonata in March 2025.
How many Sonata did Hyundai sell in 2024?
Hyundai sold 61,701 Sonata in 2024. In 2023, Hyundai sold 40,655 Sonata. They sold 21,046 more units in 2024 compared to 2023 with a percent gain of 51.77% YoY.
Overview
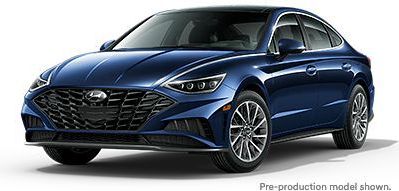
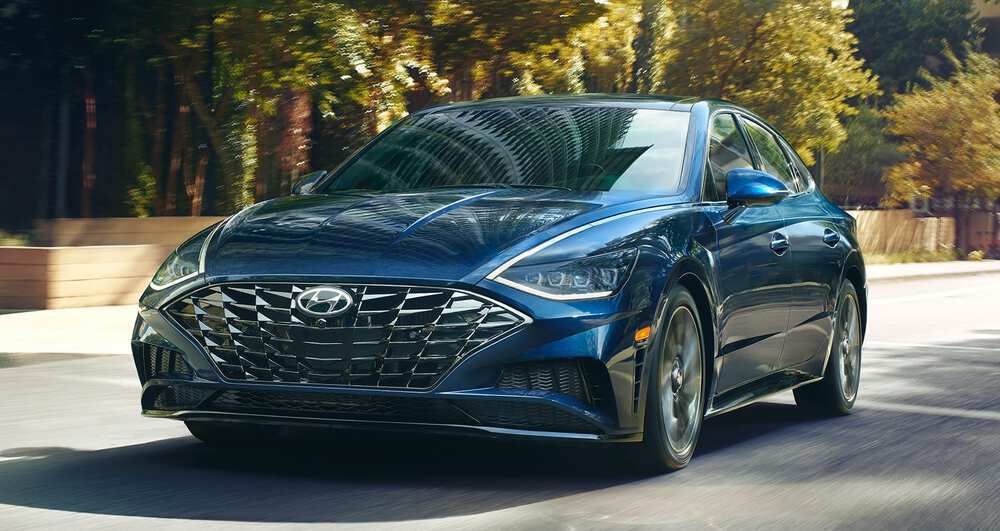
The 2022 Hyundai Sonata is a vehicle from automaker Hyundai.
How Much Does the 2022 Hyundai Sonata Cost?
Pricing for the 2022 Hyundai Sonata starts at $24,150 MSRP and goes up to $34,750 fully loaded.
Hyundai Sonata Engine, Transmission, and Performance Numbers
Hyundai Sonata includes a 2.5-liter engine combined with an 8-Speed Electronic Automatic. This delivers 191 hp with 181 lb-ft torque delivered through a Front Wheel Drive drivetrain.
List of Hyundai Sonata Competitors
Some of Hyundai Sonata competitors include the Honda Accord and Toyota Camry.
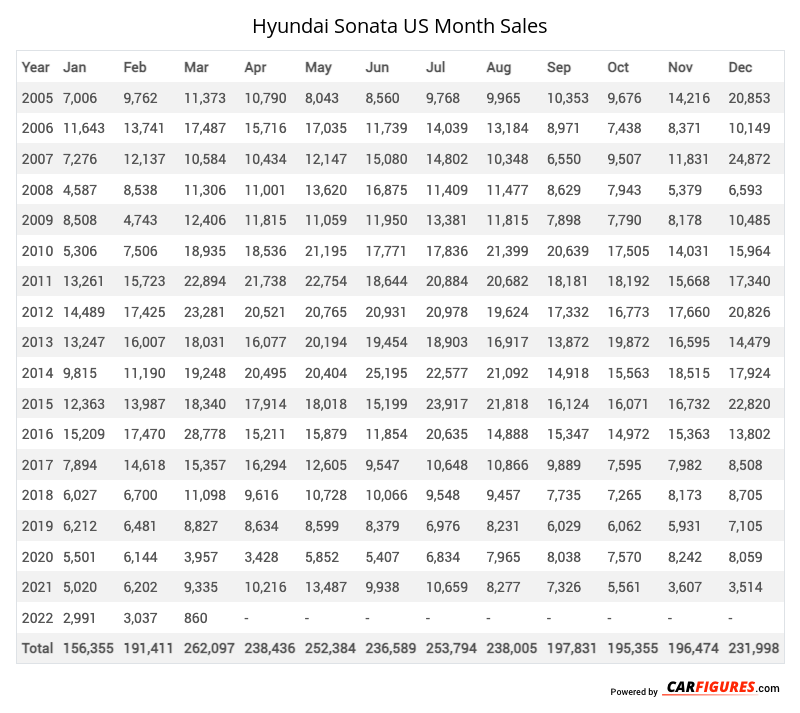
Hyundai Sonata United States Sale figures by year, quarter, and month are presented below. Including the most up to date sales data for the Hyundai Sonata. See how the Hyundai Sonata stacks up the other models in the Cars, Midsize Cars segments.
Year | Jan | Feb | Mar | Apr | May | Jun | Jul | Aug | Sep | Oct | Nov | Dec |
|---|---|---|---|---|---|---|---|---|---|---|---|---|
| 2005 | 7,006 | 9,762 | 11,373 | 10,790 | 8,043 | 8,560 | 9,768 | 9,965 | 10,353 | 9,676 | 14,216 | 20,853 |
| 2006 | 11,643 | 13,741 | 17,487 | 15,716 | 17,035 | 11,739 | 14,039 | 13,184 | 8,971 | 7,438 | 8,371 | 10,149 |
| 2007 | 7,276 | 12,137 | 10,584 | 10,434 | 12,147 | 15,080 | 14,802 | 10,348 | 6,550 | 9,507 | 11,831 | 24,872 |
| 2008 | 4,587 | 8,538 | 11,306 | 11,001 | 13,620 | 16,875 | 11,409 | 11,477 | 8,629 | 7,943 | 5,379 | 6,593 |
| 2009 | 8,508 | 4,743 | 12,406 | 11,815 | 11,059 | 11,950 | 13,381 | 11,815 | 7,898 | 7,790 | 8,178 | 10,485 |
| 2010 | 5,306 | 7,506 | 18,935 | 18,536 | 21,195 | 17,771 | 17,836 | 21,399 | 20,639 | 17,505 | 14,031 | 15,964 |
| 2011 | 13,261 | 15,723 | 22,894 | 21,738 | 22,754 | 18,644 | 20,884 | 20,682 | 18,181 | 18,192 | 15,668 | 17,340 |
| 2012 | 14,489 | 17,425 | 23,281 | 20,521 | 20,765 | 20,931 | 20,978 | 19,624 | 17,332 | 16,773 | 17,660 | 20,826 |
| 2013 | 13,247 | 16,007 | 18,031 | 16,077 | 20,194 | 19,454 | 18,903 | 16,917 | 13,872 | 19,872 | 16,595 | 14,479 |
| 2014 | 9,815 | 11,190 | 19,248 | 20,495 | 20,404 | 25,195 | 22,577 | 21,092 | 14,918 | 15,563 | 18,515 | 17,924 |
| 2015 | 12,363 | 13,987 | 18,340 | 17,914 | 18,018 | 15,199 | 23,917 | 21,818 | 16,124 | 16,071 | 16,732 | 22,820 |
| 2016 | 15,209 | 17,470 | 28,778 | 15,211 | 15,879 | 11,854 | 20,635 | 14,888 | 15,347 | 14,972 | 15,363 | 13,802 |
| 2017 | 7,894 | 14,618 | 15,357 | 16,294 | 12,605 | 9,547 | 10,648 | 10,866 | 9,889 | 7,595 | 7,982 | 8,508 |
| 2018 | 6,027 | 6,700 | 11,098 | 9,616 | 10,728 | 10,066 | 9,548 | 9,457 | 7,735 | 7,265 | 8,173 | 8,705 |
| 2019 | 6,212 | 6,481 | 8,827 | 8,634 | 8,599 | 8,379 | 6,976 | 8,231 | 6,029 | 6,062 | 5,931 | 7,105 |
| 2020 | 5,501 | 6,144 | 3,957 | 3,428 | 5,852 | 5,407 | 6,834 | 7,965 | 8,038 | 7,570 | 8,242 | 8,059 |
| 2021 | 5,020 | 6,202 | 9,335 | 10,216 | 13,487 | 9,938 | 10,659 | 8,277 | 7,326 | 5,561 | 3,607 | 3,514 |
| 2022 | 2,991 | 3,037 | 860 | 2,062 | 5,053 | 4,736 | 4,633 | 4,833 | 6,177 | 6,796 | 6,216 | 6,881 |
| 2023 | 4,873 | 4,307 | 5,310 | 0 | 4,321 | 3,834 | 3,209 | 3,397 | 3,401 | 2,460 | 2,321 | 3,222 |
| 2024 | 3,121 | 4,379 | 5,664 | 5,348 | 6,700 | 5,935 | 5,755 | 5,953 | 5,575 | 6,300 | 6,971 | 0 |
| 2025 | - | 5,334 | 5,706 | - | - | - | - | - | - | - | - | - |
| Total | 164,349 | 205,431 | 278,777 | 245,846 | 268,458 | 251,094 | 267,391 | 252,188 | 212,984 | 210,911 | 211,982 | 242,101 |
Year | Q1 | Q2 | Q3 | Q4 |
|---|---|---|---|---|
| 2005 | 28,141 | 27,393 | 30,086 | 44,745 |
| 2006 | 42,871 | 44,490 | 36,194 | 25,958 |
| 2007 | 29,997 | 37,661 | 31,700 | 46,210 |
| 2008 | 24,431 | 41,496 | 31,515 | 19,915 |
| 2009 | 25,657 | 34,824 | 33,094 | 26,453 |
| 2010 | 31,747 | 57,502 | 59,874 | 47,500 |
| 2011 | 51,878 | 63,136 | 59,747 | 51,200 |
| 2012 | 55,195 | 62,217 | 57,934 | 55,259 |
| 2013 | 47,285 | 55,725 | 49,692 | 50,946 |
| 2014 | 40,253 | 66,094 | 58,587 | 52,002 |
| 2015 | 44,690 | 51,131 | 61,859 | 55,623 |
| 2016 | 61,457 | 42,944 | 50,870 | 44,137 |
| 2017 | 37,869 | 38,446 | 31,403 | 24,085 |
| 2018 | 23,825 | 30,410 | 26,740 | 24,143 |
| 2019 | 21,520 | 25,612 | 21,236 | 19,098 |
| 2020 | 15,602 | 14,687 | 22,837 | 23,871 |
| 2021 | 20,557 | 33,641 | 26,262 | 12,682 |
| 2022 | 6,888 | 11,851 | 15,643 | 19,893 |
| 2023 | 14,490 | 8,155 | 10,007 | 8,003 |
| 2024 | 13,164 | 17,983 | 17,283 | 13,271 |
| 2025 | 11,040 | - | - | - |
| Total | 648,557 | 765,398 | 732,563 | 664,994 |
Year | Sales |
|---|---|
| 2024 | 61,701 |
| 2023 | 40,655 |
| 2022 | 54,275 |
| 2021 | 93,142 |
| 2020 | 76,997 |
| 2019 | 87,466 |
| 2018 | 105,118 |
| 2017 | 131,803 |
| 2016 | 199,408 |
| 2015 | 213,303 |
| 2014 | 216,936 |
| 2013 | 203,648 |
| 2012 | 230,605 |
| 2011 | 225,961 |
| 2010 | 196,623 |
| 2009 | 120,028 |
| 2008 | 117,357 |
| 2007 | 145,568 |
| 2006 | 149,513 |
| 2005 | 130,365 |
| Total | 2,800,472 |
Download Historic Sales Data


Embedded Code
See more widgetsSources: Manufacturers