Overview
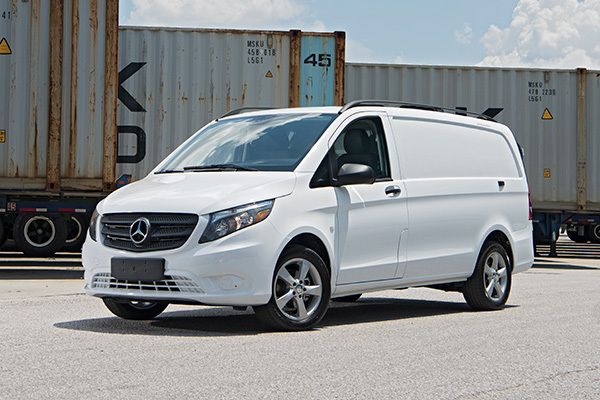
The 2022 Mercedes-Benz Metris is a vehicle from automaker Mercedes-Benz.
Mercedes-Benz Metris Engine, Transmission, and Performance Numbers
Mercedes-Benz Metris includes a 2.0-liter engine combined with a 9-Speed Automatic 9G-TRONIC. This delivers 208 hp with 258 lb-ft torque delivered through a Rear Wheel Drive drivetrain.
List of Mercedes-Benz Metris Competitors
Some of Mercedes-Benz Metris competitors include the Ford Transit Connect and Nissan NV200.
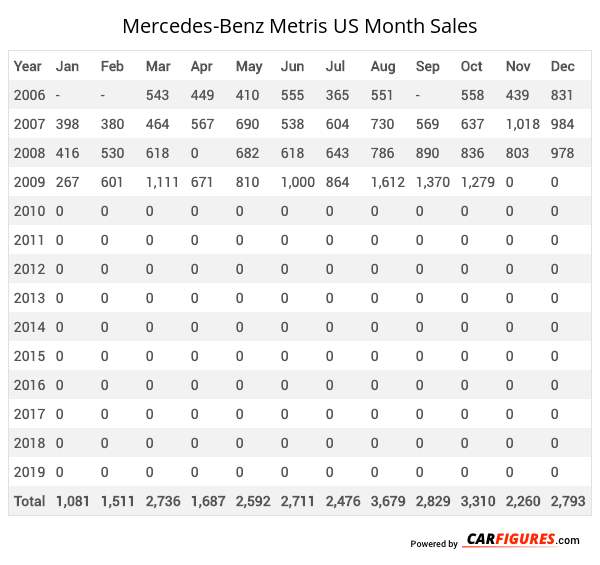
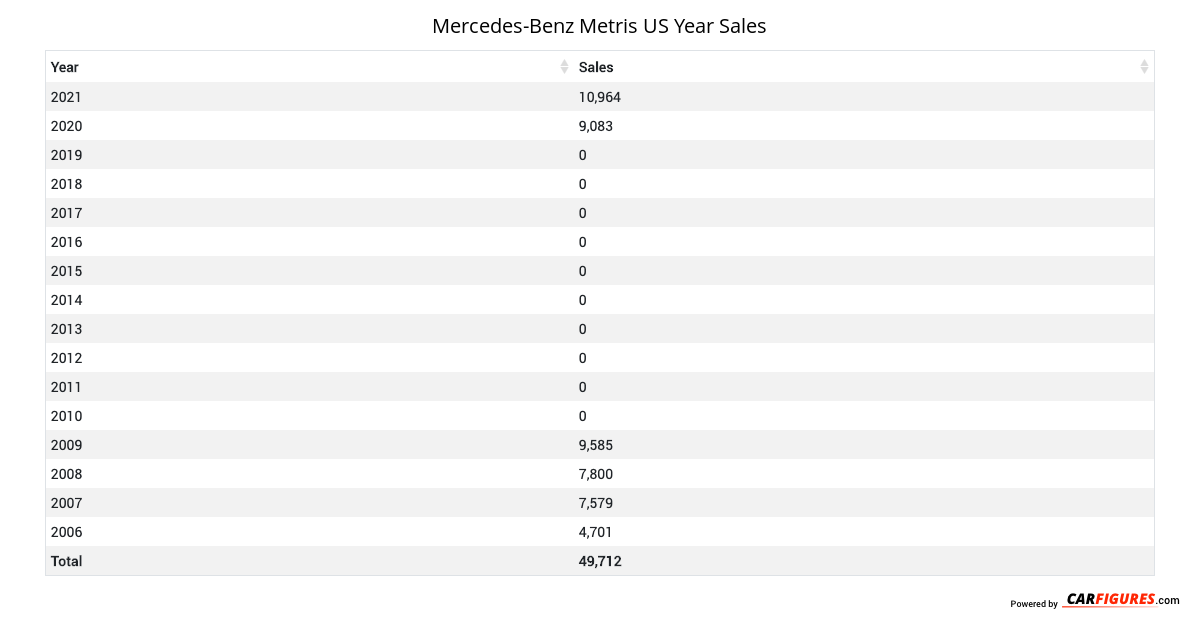
Mercedes-Benz Metris United States Sale figures by year, quarter, and month are presented below. Including the most up to date sales data for the Mercedes-Benz Metris. See how the Mercedes-Benz Metris stacks up the other models in the Cargo/Passenger Vans, Vans segments.
For sales numbers of the Mercedes-Benz Metris in Canada, click here.
Loading, please wait
Year | Jan | Feb | Mar | Apr | May | Jun | Jul | Aug | Sep | Oct | Nov | Dec |
|---|---|---|---|---|---|---|---|---|---|---|---|---|
| 2006 | - | - | 543 | 449 | 410 | 555 | 365 | 551 | - | 558 | 439 | 831 |
| 2007 | 398 | 380 | 464 | 567 | 690 | 538 | 604 | 730 | 569 | 637 | 1,018 | 984 |
| 2008 | 416 | 530 | 618 | 0 | 682 | 618 | 643 | 786 | 890 | 836 | 803 | 978 |
| 2009 | 267 | 601 | 1,111 | 671 | 810 | 1,000 | 864 | 1,612 | 1,370 | 1,279 | 0 | 0 |
| 2010 | 0 | 0 | 0 | 0 | 0 | 0 | 0 | 0 | 0 | 0 | 0 | 0 |
| 2011 | 0 | 0 | 0 | 0 | 0 | 0 | 0 | 0 | 0 | 0 | 0 | 0 |
| 2012 | 0 | 0 | 0 | 0 | 0 | 0 | 0 | 0 | 0 | 0 | 0 | 0 |
| 2013 | 0 | 0 | 0 | 0 | 0 | 0 | 0 | 0 | 0 | 0 | 0 | 0 |
| 2014 | 0 | 0 | 0 | 0 | 0 | 0 | 0 | 0 | 0 | 0 | 0 | 0 |
| 2015 | 0 | 0 | 0 | 0 | 0 | 0 | 0 | 0 | 0 | 0 | 0 | 0 |
| 2016 | 0 | 0 | 0 | 0 | 0 | 0 | 0 | 0 | 0 | 0 | 0 | 0 |
| 2017 | 0 | 0 | 0 | 0 | 0 | 0 | 0 | 0 | 0 | 0 | 0 | 0 |
| 2018 | 0 | 0 | 0 | 0 | 0 | 0 | 0 | 0 | 0 | 0 | 0 | 0 |
| 2019 | 0 | 0 | 0 | 0 | 0 | 0 | 0 | 0 | 0 | 0 | 0 | 0 |
| Total | 1,081 | 1,511 | 2,736 | 1,687 | 2,592 | 2,711 | 2,476 | 3,679 | 2,829 | 3,310 | 2,260 | 2,793 |
Loading, please wait
Year | Q1 | Q2 | Q3 | Q4 |
|---|---|---|---|---|
| 2006 | 543 | 1,414 | 916 | 1,828 |
| 2007 | 1,242 | 1,795 | 1,903 | 2,639 |
| 2008 | 1,564 | 1,300 | 2,319 | 2,617 |
| 2009 | 1,979 | 2,481 | 3,846 | 1,279 |
| 2010 | 0 | 0 | 0 | 0 |
| 2011 | 0 | 0 | 0 | 0 |
| 2012 | 0 | 0 | 0 | 0 |
| 2013 | 0 | 0 | 0 | 0 |
| 2014 | 0 | 0 | 0 | 0 |
| 2015 | 0 | 0 | 0 | 0 |
| 2016 | 0 | 0 | 0 | 0 |
| 2017 | 0 | 0 | 0 | 0 |
| 2018 | 0 | 0 | 0 | 0 |
| 2019 | 0 | 0 | 0 | 0 |
| 2020 | 1,654 | 2,044 | 3,145 | 2,240 |
| 2021 | 2,798 | 1,810 | 3,372 | 2,984 |
| 2022 | 0 | 4,934 | 0 | 0 |
| 2023 | 0 | 0 | 0 | 0 |
| 2024 | 0 | 0 | 0 | 0 |
| 2025 | - | - | - | - |
| Total | 9,780 | 15,778 | 15,501 | 13,587 |
Loading, please wait
Year | Sales |
|---|---|
| 2022 | 4,934 |
| 2021 | 10,964 |
| 2020 | 9,083 |
| 2019 | 0 |
| 2018 | 0 |
| 2017 | 0 |
| 2016 | 0 |
| 2015 | 0 |
| 2014 | 0 |
| 2013 | 0 |
| 2012 | 0 |
| 2011 | 0 |
| 2010 | 0 |
| 2009 | 9,585 |
| 2008 | 7,800 |
| 2007 | 7,579 |
| 2006 | 4,701 |
| Total | 54,646 |
Download Historic Sales Data

Embedded Code
See more widgetsSources: Manufacturers