Key Stats
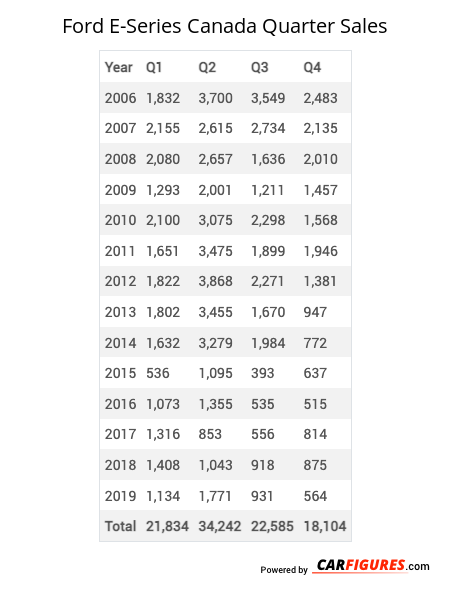
How many E-Series did Ford sell in Q4 2019?
Ford sold 564 E-Series in Q4 2019.
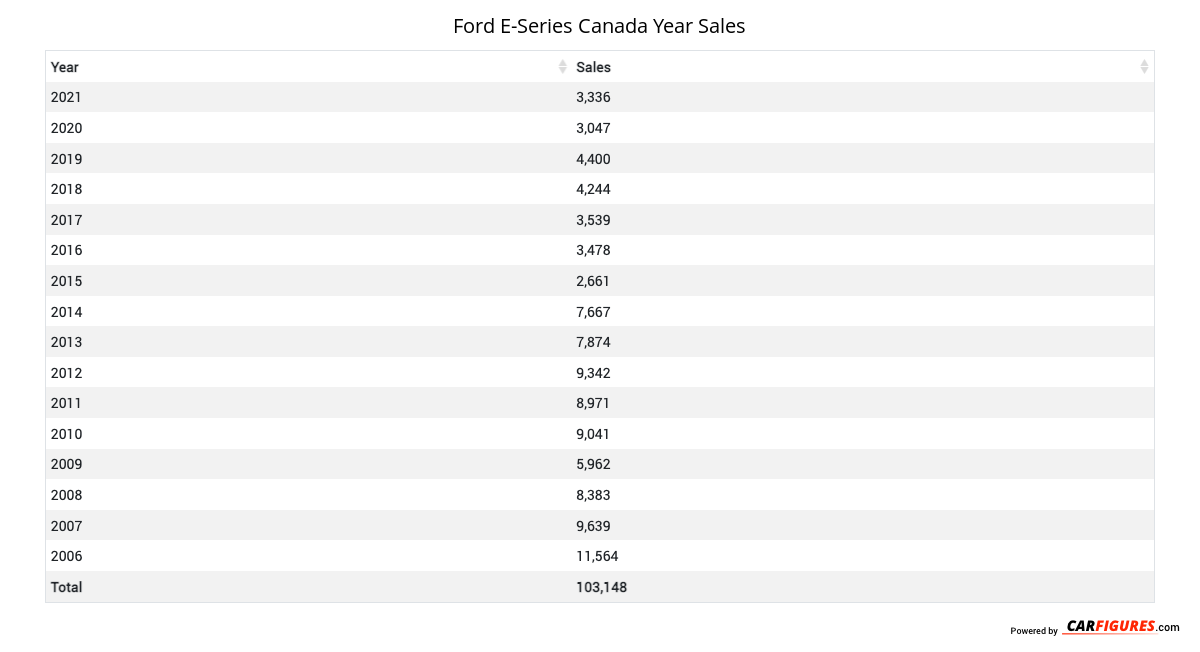
How many E-Series did Ford sell in 2021?
Ford sold 3,336 E-Series in 2021. In 2020, Ford sold 3,047 E-Series. They sold 289 more units in 2021 compared to 2020 with a percent gain of 9.48% YoY.
Overview
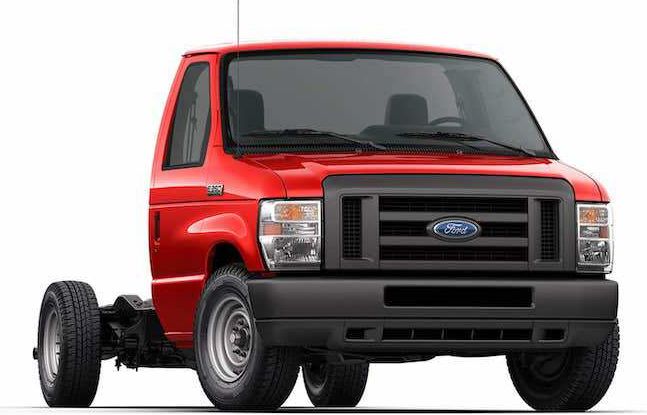
The 2022 Ford E-Series Cutaway is a vehicle from automaker Ford.
How Much Does the 2022 Ford E-Series Cutaway Cost?
The 2022 Ford E-Series Cutaway starts at $39,220 MSRP. Fully loaded, the Ford E-Series Cutaway will cost you about $42,520.
Ford E-Series Cutaway Engine, Transmission, and Performance Numbers
Ford E-Series Cutaway is powered by a rear-wheel-drive powertrain that makes 300 horsepower and 425 ft-lb torque.
List of Ford E-Series Cutaway Competitors
Some of Ford E-Series Cutaway competitors include the Ram ProMaster City, Chevrolet Express and Ford Transit.
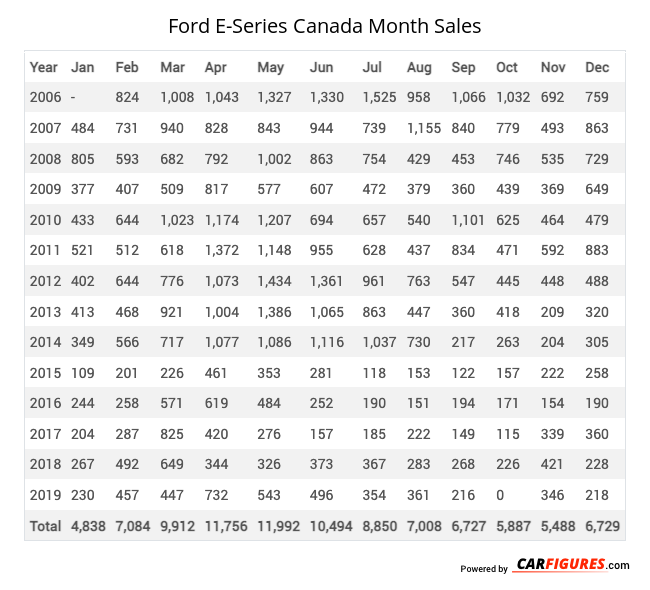
Ford E-Series Canadian Sale figures by year, quarter, and month are presented below. Including the most up to date sales data for the Ford E-Series.
*Sales report includes Club Wagon, Econoline
Year | Jan | Feb | Mar | Apr | May | Jun | Jul | Aug | Sep | Oct | Nov | Dec |
|---|---|---|---|---|---|---|---|---|---|---|---|---|
| 2006 | - | 824 | 1,008 | 1,043 | 1,327 | 1,330 | 1,525 | 958 | 1,066 | 1,032 | 692 | 759 |
| 2007 | 484 | 731 | 940 | 828 | 843 | 944 | 739 | 1,155 | 840 | 779 | 493 | 863 |
| 2008 | 805 | 593 | 682 | 792 | 1,002 | 863 | 754 | 429 | 453 | 746 | 535 | 729 |
| 2009 | 377 | 407 | 509 | 817 | 577 | 607 | 472 | 379 | 360 | 439 | 369 | 649 |
| 2010 | 433 | 644 | 1,023 | 1,174 | 1,207 | 694 | 657 | 540 | 1,101 | 625 | 464 | 479 |
| 2011 | 521 | 512 | 618 | 1,372 | 1,148 | 955 | 628 | 437 | 834 | 471 | 592 | 883 |
| 2012 | 402 | 644 | 776 | 1,073 | 1,434 | 1,361 | 961 | 763 | 547 | 445 | 448 | 488 |
| 2013 | 413 | 468 | 921 | 1,004 | 1,386 | 1,065 | 863 | 447 | 360 | 418 | 209 | 320 |
| 2014 | 349 | 566 | 717 | 1,077 | 1,086 | 1,116 | 1,037 | 730 | 217 | 263 | 204 | 305 |
| 2015 | 109 | 201 | 226 | 461 | 353 | 281 | 118 | 153 | 122 | 157 | 222 | 258 |
| 2016 | 244 | 258 | 571 | 619 | 484 | 252 | 190 | 151 | 194 | 171 | 154 | 190 |
| 2017 | 204 | 287 | 825 | 420 | 276 | 157 | 185 | 222 | 149 | 115 | 339 | 360 |
| 2018 | 267 | 492 | 649 | 344 | 326 | 373 | 367 | 283 | 268 | 226 | 421 | 228 |
| 2019 | 230 | 457 | 447 | 732 | 543 | 496 | 354 | 361 | 216 | 0 | 346 | 218 |
| Total | 4,838 | 7,084 | 9,912 | 11,756 | 11,992 | 10,494 | 8,850 | 7,008 | 6,727 | 5,887 | 5,488 | 6,729 |
Year | Q1 | Q2 | Q3 | Q4 |
|---|---|---|---|---|
| 2006 | 1,832 | 3,700 | 3,549 | 2,483 |
| 2007 | 2,155 | 2,615 | 2,734 | 2,135 |
| 2008 | 2,080 | 2,657 | 1,636 | 2,010 |
| 2009 | 1,293 | 2,001 | 1,211 | 1,457 |
| 2010 | 2,100 | 3,075 | 2,298 | 1,568 |
| 2011 | 1,651 | 3,475 | 1,899 | 1,946 |
| 2012 | 1,822 | 3,868 | 2,271 | 1,381 |
| 2013 | 1,802 | 3,455 | 1,670 | 947 |
| 2014 | 1,632 | 3,279 | 1,984 | 772 |
| 2015 | 536 | 1,095 | 393 | 637 |
| 2016 | 1,073 | 1,355 | 535 | 515 |
| 2017 | 1,316 | 853 | 556 | 814 |
| 2018 | 1,408 | 1,043 | 918 | 875 |
| 2019 | 1,134 | 1,771 | 931 | 564 |
| Total | 21,834 | 34,242 | 22,585 | 18,104 |
Year | Sales |
|---|---|
| 2021 | 3,336 |
| 2020 | 3,047 |
| 2019 | 4,400 |
| 2018 | 4,244 |
| 2017 | 3,539 |
| 2016 | 3,478 |
| 2015 | 2,661 |
| 2014 | 7,667 |
| 2013 | 7,874 |
| 2012 | 9,342 |
| 2011 | 8,971 |
| 2010 | 9,041 |
| 2009 | 5,962 |
| 2008 | 8,383 |
| 2007 | 9,639 |
| 2006 | 11,564 |
| Total | 103,148 |
Download Historic Sales Data
Looking for more data/visualizations? Send us an email at contact@carfigures.com for customized data aggregates and visualizations.Embedded Code
See more widgetsSources: Manufacturers

