Key Stats
How many Enclave did Buick sell in 2024?
Buick sold 26,398 Enclave in 2024. In 2023, Buick sold 28,859 Enclave. They sold 2,461 more units in year 2023 compared to 2024 with a percent loss of 8.53% YoY.
Overview
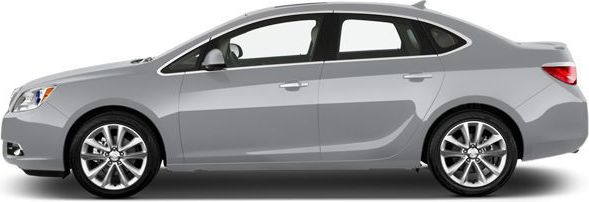
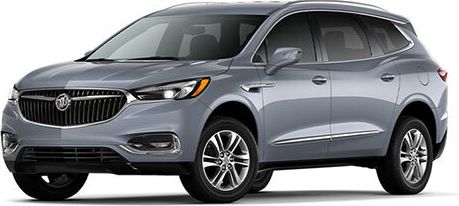
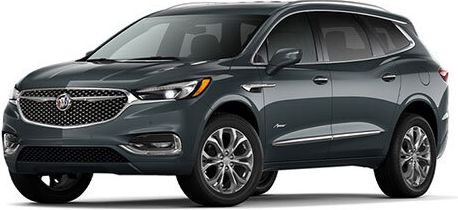
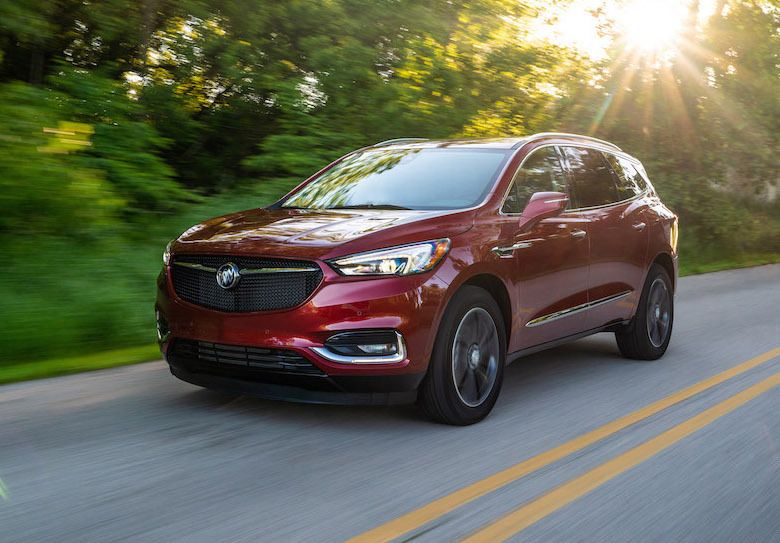
The 2024 Buick Enclave is a vehicle from automaker Buick.
How Much Does the 2024 Buick Enclave Cost?
The 2024 Buick Enclave starts at $43,900 MSRP. Fully loaded, the Buick Enclave will cost you about $59,500.
Buick Enclave Engine, Transmission, and Performance Numbers
The Buick Enclave includes a 3.6-liter coupled with a that delivers 310 hp and 266 lb-ft torque with a Front Wheel Drive drivetrain.
List of Buick Enclave Competitors
Some of Buick Enclave competitors include the Kia Telluride, Hyundai Palisade and Honda Pilot.
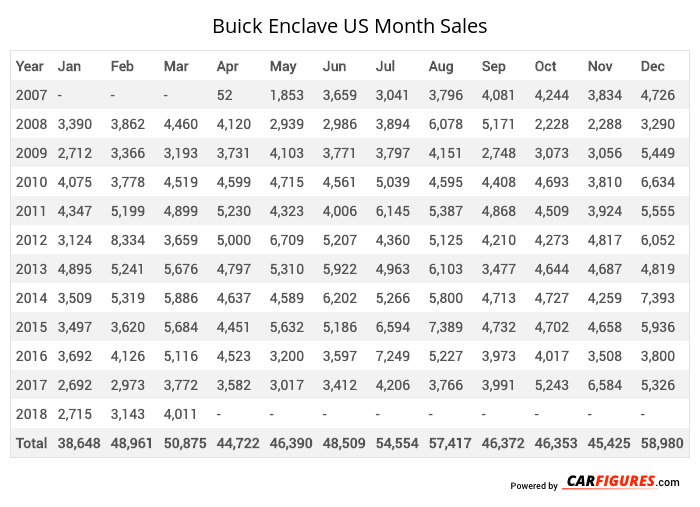
Buick Enclave United States Sale figures by year, quarter, and month are presented below. Including the most up to date sales data for the Buick Enclave. See how the Buick Enclave stacks up the other models in the Crossover/SUVS, Premium Midsize Crossover/SUVs segments.
Year | Jan | Feb | Mar | Apr | May | Jun | Jul | Aug | Sep | Oct | Nov | Dec |
|---|---|---|---|---|---|---|---|---|---|---|---|---|
| 2007 | - | - | - | 52 | 1,853 | 3,659 | 3,041 | 3,796 | 4,081 | 4,244 | 3,834 | 4,726 |
| 2008 | 3,390 | 3,862 | 4,460 | 4,120 | 2,939 | 2,986 | 3,894 | 6,078 | 5,171 | 2,228 | 2,288 | 3,290 |
| 2009 | 2,712 | 3,366 | 3,193 | 3,731 | 4,103 | 3,771 | 3,797 | 4,151 | 2,748 | 3,073 | 3,056 | 5,449 |
| 2010 | 4,075 | 3,778 | 4,519 | 4,599 | 4,715 | 4,561 | 5,039 | 4,595 | 4,408 | 4,693 | 3,810 | 6,634 |
| 2011 | 4,347 | 5,199 | 4,899 | 5,230 | 4,323 | 4,006 | 6,145 | 5,387 | 4,868 | 4,509 | 3,924 | 5,555 |
| 2012 | 3,124 | 8,334 | 3,659 | 5,000 | 6,709 | 5,207 | 4,360 | 5,125 | 4,210 | 4,273 | 4,817 | 6,052 |
| 2013 | 4,895 | 5,241 | 5,676 | 4,797 | 5,310 | 5,922 | 4,963 | 6,103 | 3,477 | 4,644 | 4,687 | 4,819 |
| 2014 | 3,509 | 5,319 | 5,886 | 4,637 | 4,589 | 6,202 | 5,266 | 5,800 | 4,713 | 4,727 | 4,259 | 7,393 |
| 2015 | 3,497 | 3,620 | 5,684 | 4,451 | 5,632 | 5,186 | 6,594 | 7,389 | 4,732 | 4,702 | 4,658 | 5,936 |
| 2016 | 3,692 | 4,126 | 5,116 | 4,523 | 3,200 | 3,597 | 7,249 | 5,227 | 3,973 | 4,017 | 3,508 | 3,800 |
| 2017 | 2,692 | 2,973 | 3,772 | 3,582 | 3,017 | 3,412 | 4,206 | 3,766 | 3,991 | 5,243 | 6,584 | 5,326 |
| 2018 | 2,715 | 3,143 | 4,011 | - | - | - | - | - | - | - | - | - |
| Total | 38,648 | 48,961 | 50,875 | 44,722 | 46,390 | 48,509 | 54,554 | 57,417 | 46,372 | 46,353 | 45,425 | 58,980 |
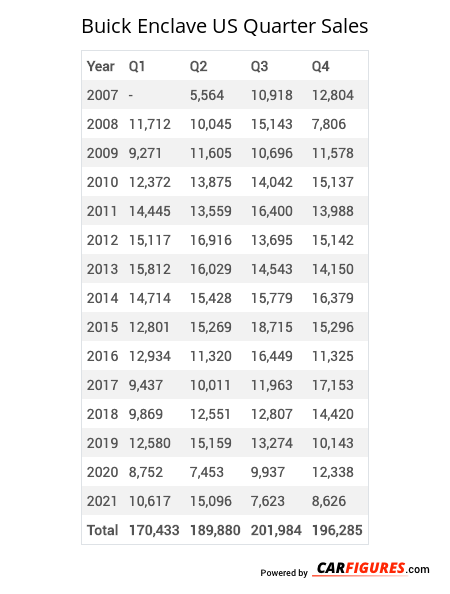
Year | Q1 | Q2 | Q3 | Q4 |
|---|---|---|---|---|
| 2007 | - | 5,564 | 10,918 | 12,804 |
| 2008 | 11,712 | 10,045 | 15,143 | 7,806 |
| 2009 | 9,271 | 11,605 | 10,696 | 11,578 |
| 2010 | 12,372 | 13,875 | 14,042 | 15,137 |
| 2011 | 14,445 | 13,559 | 16,400 | 13,988 |
| 2012 | 15,117 | 16,916 | 13,695 | 15,142 |
| 2013 | 15,812 | 16,029 | 14,543 | 14,150 |
| 2014 | 14,714 | 15,428 | 15,779 | 16,379 |
| 2015 | 12,801 | 15,269 | 18,715 | 15,296 |
| 2016 | 12,934 | 11,320 | 16,449 | 11,325 |
| 2017 | 9,437 | 10,011 | 11,963 | 17,153 |
| 2018 | 9,869 | 12,551 | 12,807 | 14,420 |
| 2019 | 12,580 | 15,159 | 13,274 | 10,143 |
| 2020 | 8,752 | 7,453 | 9,937 | 12,338 |
| 2021 | 10,617 | 15,096 | 7,623 | 8,626 |
| 2022 | 7,025 | 7,885 | 7,903 | 7,719 |
| 2023 | 8,803 | 9,127 | 0 | 10,929 |
| 2024 | 8,101 | 5,885 | 5,161 | 7,251 |
| 2025 | - | - | - | - |
| Total | 194,362 | 212,777 | 215,048 | 222,184 |
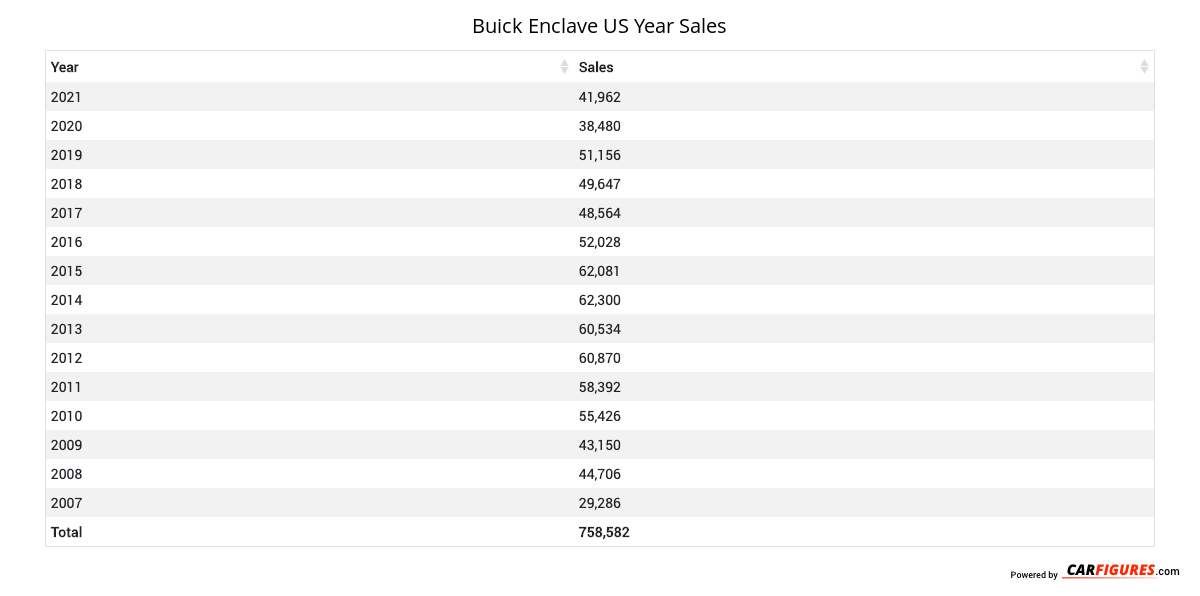
Year | Sales |
|---|---|
| 2024 | 26,398 |
| 2023 | 28,859 |
| 2022 | 30,532 |
| 2021 | 41,962 |
| 2020 | 38,480 |
| 2019 | 51,156 |
| 2018 | 49,647 |
| 2017 | 48,564 |
| 2016 | 52,028 |
| 2015 | 62,081 |
| 2014 | 62,300 |
| 2013 | 60,534 |
| 2012 | 60,870 |
| 2011 | 58,392 |
| 2010 | 55,426 |
| 2009 | 43,150 |
| 2008 | 44,706 |
| 2007 | 29,286 |
| Total | 844,371 |
Download Historic Sales Data
Embedded Code
See more widgetsSources: Manufacturers