

Key Stats
How many Telluride did Kia sell in 2025?
Kia sold 29,843 Telluride in 2025. (From Jan - Mar 2025)
How many Telluride did Kia sell in March 2025?
Kia sold 11,473 Telluride in March 2025.
How many Telluride did Kia sell in 2024?
Kia sold 115,504 Telluride in 2024. In 2023, Kia sold 100,974 Telluride. They sold 14,530 more units in 2024 compared to 2023 with a percent gain of 14.39% YoY.
Overview
The 2024 Kia Telluride is a vehicle from automaker Kia.
How Much Does the 2024 Kia Telluride Cost?
Pricing for the 2024 Kia Telluride starts at $35,990 MSRP and goes up to $53,185 fully loaded.
Kia Telluride Engine, Transmission, and Performance Numbers
The Kia Telluride includes a 3.8-liter coupled with an 8-Speed Automatic that delivers 291 hp and 262 lb-ft torque with a Front Wheel Drive drivetrain.
List of Kia Telluride Competitors
Some of Kia Telluride competitors include the Honda Pilot, Mazda CX-9 and Volkswagen Atlas.
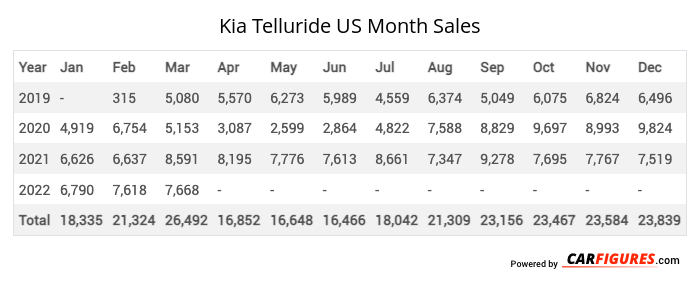
Kia Telluride United States Sale figures by year, quarter, and month are presented below. Including the most up to date sales data for the Kia Telluride. See how the Kia Telluride stacks up the other models in the Crossover/SUVS, Midsize Crossover/SUVs segments.
Year | Jan | Feb | Mar | Apr | May | Jun | Jul | Aug | Sep | Oct | Nov | Dec |
|---|---|---|---|---|---|---|---|---|---|---|---|---|
| 2019 | - | 315 | 5,080 | 5,570 | 6,273 | 5,989 | 4,559 | 6,374 | 5,049 | 6,075 | 6,824 | 6,496 |
| 2020 | 4,919 | 6,754 | 5,153 | 3,087 | 2,599 | 2,864 | 4,822 | 7,588 | 8,829 | 9,697 | 8,993 | 9,824 |
| 2021 | 6,626 | 6,637 | 8,591 | 8,195 | 7,776 | 7,613 | 8,661 | 7,347 | 9,278 | 7,695 | 7,767 | 7,519 |
| 2022 | 6,790 | 7,618 | 7,668 | 8,233 | 7,398 | 9,186 | 8,318 | 8,318 | 8,440 | 8,179 | 8,558 | 10,858 |
| 2023 | 7,582 | 9,023 | 10,585 | 8,555 | 10,005 | 9,534 | 9,759 | 0 | 9,147 | 8,533 | 8,810 | 9,441 |
| 2024 | 6,916 | 8,510 | 10,152 | 8,949 | 10,315 | 8,858 | 9,082 | 10,273 | 8,699 | 9,694 | 11,568 | 12,488 |
| 2025 | 8,771 | 9,599 | 11,473 | - | - | - | - | - | - | - | - | - |
| Total | 41,604 | 48,456 | 58,702 | 42,589 | 44,366 | 44,044 | 45,201 | 39,900 | 49,442 | 49,873 | 52,520 | 56,626 |
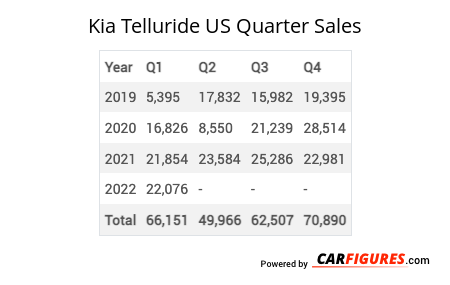
Year | Q1 | Q2 | Q3 | Q4 |
|---|---|---|---|---|
| 2019 | 5,395 | 17,832 | 15,982 | 19,395 |
| 2020 | 16,826 | 8,550 | 21,239 | 28,514 |
| 2021 | 21,854 | 23,584 | 25,286 | 22,981 |
| 2022 | 22,076 | 24,817 | 25,076 | 27,595 |
| 2023 | 27,190 | 28,094 | 18,906 | 26,784 |
| 2024 | 25,578 | 28,122 | 28,054 | 33,750 |
| 2025 | 29,843 | - | - | - |
| Total | 148,762 | 130,999 | 134,543 | 159,019 |
Year | Sales |
|---|---|
| 2024 | 115,504 |
| 2023 | 100,974 |
| 2022 | 99,564 |
| 2021 | 93,705 |
| 2020 | 75,129 |
| 2019 | 58,604 |
| Total | 543,480 |
Download Historic Sales Data

Embedded Code
See more widgetsSources: Manufacturers