Key Stats
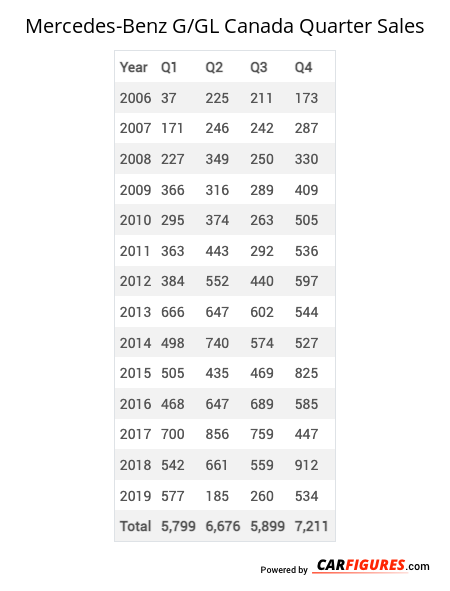
How many G/GL did Mercedes-Benz sell in Q4 2019?
Mercedes-Benz sold 534 G/GL in Q4 2019.
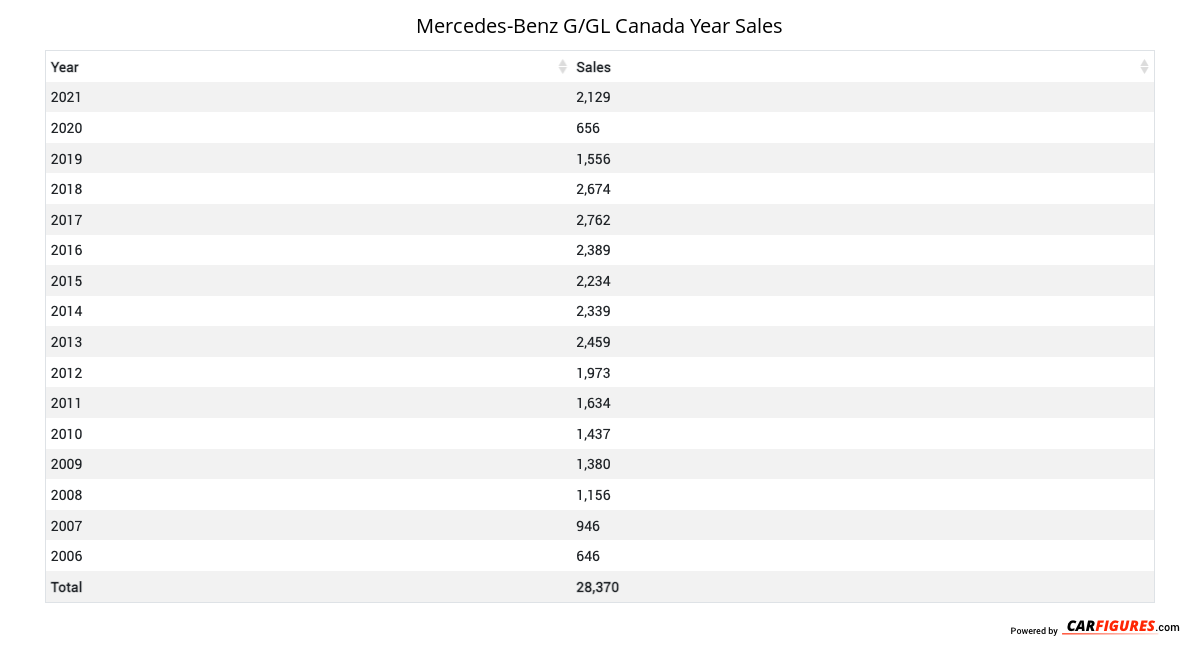
How many G/GL did Mercedes-Benz sell in 2021?
Mercedes-Benz sold 2,129 G/GL in 2021. In 2020, Mercedes-Benz sold 656 G/GL. They sold 1,473 more units in 2021 compared to 2020 with a percent gain of 224.54% YoY.
Overview
The 2021 Mercedes-Benz G-Class is a vehicle from automaker Mercedes-Benz.
How Much Does the 2021 Mercedes-Benz G-Class Cost?
Pricing for the 2021 Mercedes-Benz G-Class starts at $154,900 MSRP and goes up to $211,900 fully loaded.
Mercedes-Benz G-Class Engine, Transmission, and Performance Numbers
Mercedes-Benz G-Class is powered by a all-wheel-drive powertrain that makes 416 horsepower and 450 ft-lb torque.
List of Mercedes-Benz G-Class Competitors
Some of Mercedes-Benz G-Class competitors include the BMW X7, Land Rover Range Rover, Lexus LX, BMW X5, BMW X6 and Land Rover Range Rover Sport.
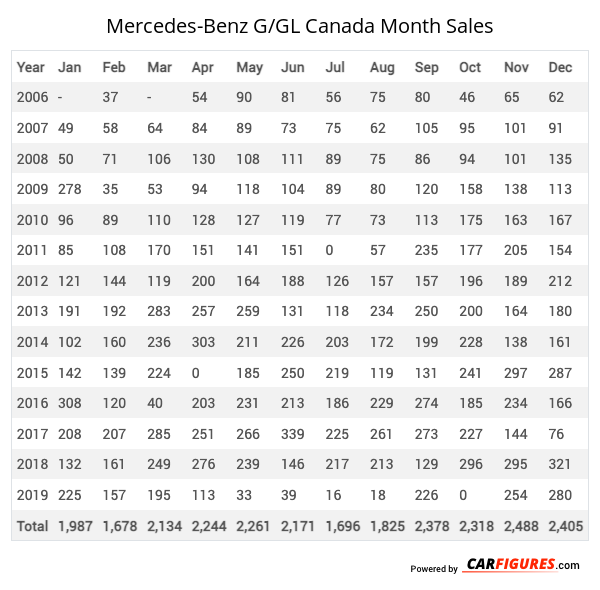
Mercedes-Benz G/GL Canadian Sale figures by year, quarter, and month are presented below. Including the most up to date sales data for the Mercedes-Benz G/GL.
Year | Jan | Feb | Mar | Apr | May | Jun | Jul | Aug | Sep | Oct | Nov | Dec |
|---|---|---|---|---|---|---|---|---|---|---|---|---|
| 2006 | - | 37 | - | 54 | 90 | 81 | 56 | 75 | 80 | 46 | 65 | 62 |
| 2007 | 49 | 58 | 64 | 84 | 89 | 73 | 75 | 62 | 105 | 95 | 101 | 91 |
| 2008 | 50 | 71 | 106 | 130 | 108 | 111 | 89 | 75 | 86 | 94 | 101 | 135 |
| 2009 | 278 | 35 | 53 | 94 | 118 | 104 | 89 | 80 | 120 | 158 | 138 | 113 |
| 2010 | 96 | 89 | 110 | 128 | 127 | 119 | 77 | 73 | 113 | 175 | 163 | 167 |
| 2011 | 85 | 108 | 170 | 151 | 141 | 151 | 0 | 57 | 235 | 177 | 205 | 154 |
| 2012 | 121 | 144 | 119 | 200 | 164 | 188 | 126 | 157 | 157 | 196 | 189 | 212 |
| 2013 | 191 | 192 | 283 | 257 | 259 | 131 | 118 | 234 | 250 | 200 | 164 | 180 |
| 2014 | 102 | 160 | 236 | 303 | 211 | 226 | 203 | 172 | 199 | 228 | 138 | 161 |
| 2015 | 142 | 139 | 224 | 0 | 185 | 250 | 219 | 119 | 131 | 241 | 297 | 287 |
| 2016 | 308 | 120 | 40 | 203 | 231 | 213 | 186 | 229 | 274 | 185 | 234 | 166 |
| 2017 | 208 | 207 | 285 | 251 | 266 | 339 | 225 | 261 | 273 | 227 | 144 | 76 |
| 2018 | 132 | 161 | 249 | 276 | 239 | 146 | 217 | 213 | 129 | 296 | 295 | 321 |
| 2019 | 225 | 157 | 195 | 113 | 33 | 39 | 16 | 18 | 226 | 0 | 254 | 280 |
| Total | 1,987 | 1,678 | 2,134 | 2,244 | 2,261 | 2,171 | 1,696 | 1,825 | 2,378 | 2,318 | 2,488 | 2,405 |
Year | Q1 | Q2 | Q3 | Q4 |
|---|---|---|---|---|
| 2006 | 37 | 225 | 211 | 173 |
| 2007 | 171 | 246 | 242 | 287 |
| 2008 | 227 | 349 | 250 | 330 |
| 2009 | 366 | 316 | 289 | 409 |
| 2010 | 295 | 374 | 263 | 505 |
| 2011 | 363 | 443 | 292 | 536 |
| 2012 | 384 | 552 | 440 | 597 |
| 2013 | 666 | 647 | 602 | 544 |
| 2014 | 498 | 740 | 574 | 527 |
| 2015 | 505 | 435 | 469 | 825 |
| 2016 | 468 | 647 | 689 | 585 |
| 2017 | 700 | 856 | 759 | 447 |
| 2018 | 542 | 661 | 559 | 912 |
| 2019 | 577 | 185 | 260 | 534 |
| Total | 5,799 | 6,676 | 5,899 | 7,211 |
Year | Sales |
|---|---|
| 2021 | 2,129 |
| 2020 | 656 |
| 2019 | 1,556 |
| 2018 | 2,674 |
| 2017 | 2,762 |
| 2016 | 2,389 |
| 2015 | 2,234 |
| 2014 | 2,339 |
| 2013 | 2,459 |
| 2012 | 1,973 |
| 2011 | 1,634 |
| 2010 | 1,437 |
| 2009 | 1,380 |
| 2008 | 1,156 |
| 2007 | 946 |
| 2006 | 646 |
| Total | 28,370 |
Download Historic Sales Data
Looking for more data/visualizations? Send us an email at contact@carfigures.com for customized data aggregates and visualizations.Embedded Code
See more widgetsSources: Manufacturers


