Key Stats
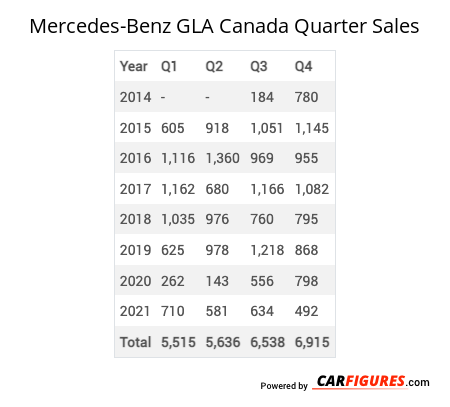
How many GLA did Mercedes-Benz sell in Q4 2021?
Mercedes-Benz sold 492 GLA in Q4 2021.
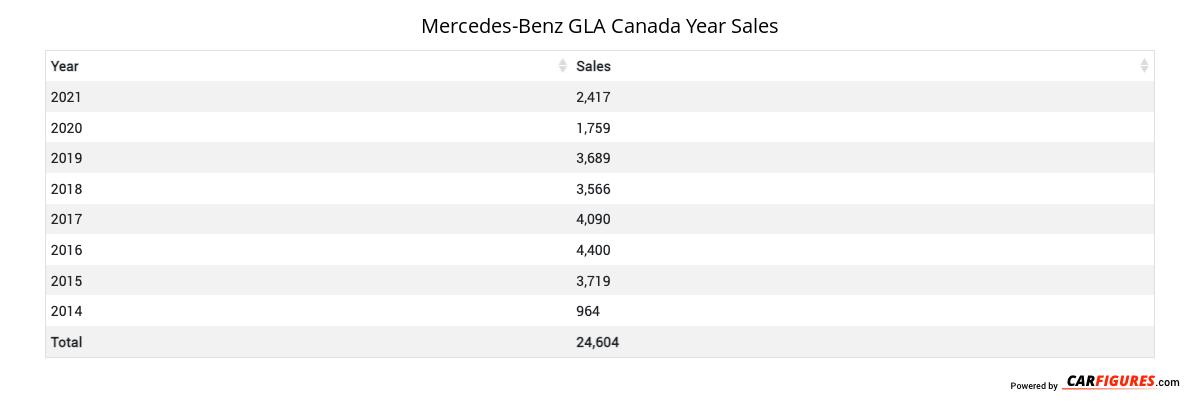
How many GLA did Mercedes-Benz sell in 2021?
Mercedes-Benz sold 2,417 GLA in 2021. In 2020, Mercedes-Benz sold 1,759 GLA. They sold 658 more units in 2021 compared to 2020 with a percent gain of 37.41% YoY.
Overview
The 2022 Mercedes-Benz GLA-Class is a vehicle from automaker Mercedes-Benz.
How Much Does the 2022 Mercedes-Benz GLA-Class Cost?
Pricing for the 2022 Mercedes-Benz GLA-Class starts at $42,900 MSRP and goes up to $63,200 fully loaded.
Mercedes-Benz GLA-Class Engine, Transmission, and Performance Numbers
Mercedes-Benz GLA-Class is powered by a all-wheel-drive powertrain that makes 221 horsepower and 258 ft-lb torque.
List of Mercedes-Benz GLA-Class Competitors
Some of Mercedes-Benz GLA-Class competitors include the BMW X2, BMW X3, Audi Q3, BMW X1, Genesis GV70, Mercedes-Benz A Class, BMW X4, Lexus NX, Land Rover Discovery Sport and Land Rover Range Rover Evoque.
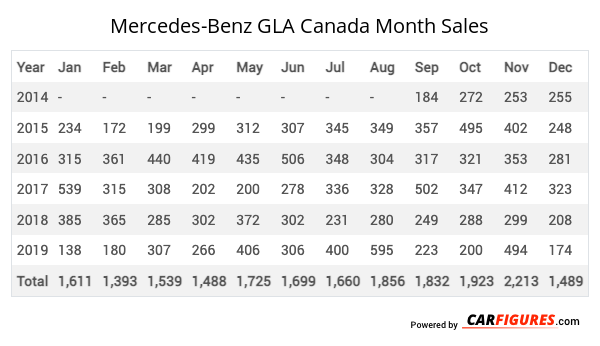
Mercedes-Benz GLA Canadian Sale figures by year, quarter, and month are presented below. Including the most up to date sales data for the Mercedes-Benz GLA.
Year | Jan | Feb | Mar | Apr | May | Jun | Jul | Aug | Sep | Oct | Nov | Dec |
|---|---|---|---|---|---|---|---|---|---|---|---|---|
| 2014 | - | - | - | - | - | - | - | - | 184 | 272 | 253 | 255 |
| 2015 | 234 | 172 | 199 | 299 | 312 | 307 | 345 | 349 | 357 | 495 | 402 | 248 |
| 2016 | 315 | 361 | 440 | 419 | 435 | 506 | 348 | 304 | 317 | 321 | 353 | 281 |
| 2017 | 539 | 315 | 308 | 202 | 200 | 278 | 336 | 328 | 502 | 347 | 412 | 323 |
| 2018 | 385 | 365 | 285 | 302 | 372 | 302 | 231 | 280 | 249 | 288 | 299 | 208 |
| 2019 | 138 | 180 | 307 | 266 | 406 | 306 | 400 | 595 | 223 | 200 | 494 | 174 |
| Total | 1,611 | 1,393 | 1,539 | 1,488 | 1,725 | 1,699 | 1,660 | 1,856 | 1,832 | 1,923 | 2,213 | 1,489 |
Year | Q1 | Q2 | Q3 | Q4 |
|---|---|---|---|---|
| 2014 | - | - | 184 | 780 |
| 2015 | 605 | 918 | 1,051 | 1,145 |
| 2016 | 1,116 | 1,360 | 969 | 955 |
| 2017 | 1,162 | 680 | 1,166 | 1,082 |
| 2018 | 1,035 | 976 | 760 | 795 |
| 2019 | 625 | 978 | 1,218 | 868 |
| 2020 | 262 | 143 | 556 | 798 |
| 2021 | 710 | 581 | 634 | 492 |
| Total | 5,515 | 5,636 | 6,538 | 6,915 |
Year | Sales |
|---|---|
| 2021 | 2,417 |
| 2020 | 1,759 |
| 2019 | 3,689 |
| 2018 | 3,566 |
| 2017 | 4,090 |
| 2016 | 4,400 |
| 2015 | 3,719 |
| 2014 | 964 |
| Total | 24,604 |
Download Historic Sales Data
Looking for more data/visualizations? Send us an email at contact@carfigures.com for customized data aggregates and visualizations.Embedded Code
See more widgetsSources: Manufacturers


