Key Stats
How many C Class did Mercedes-Benz sell in Q4 2021?
Mercedes-Benz sold 628 C Class in Q4 2021.
How many C Class did Mercedes-Benz sell in 2021?
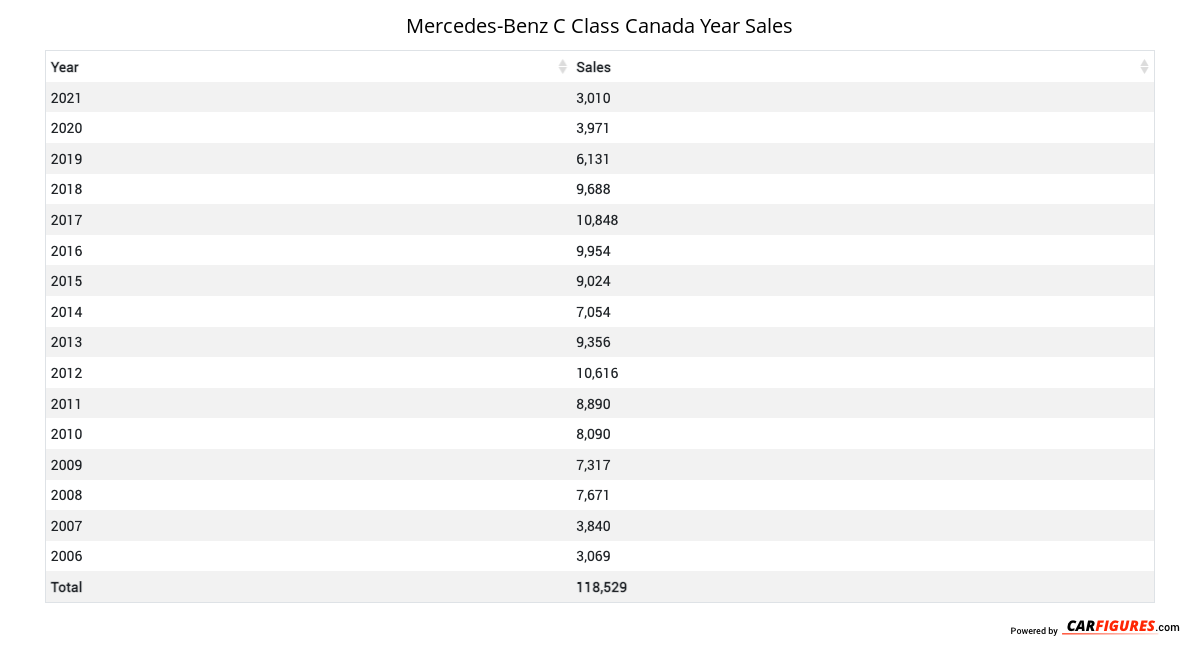
Mercedes-Benz sold 3,010 C Class in 2021. In 2020, Mercedes-Benz sold 3,971 C Class. They sold 961 more units in year 2020 compared to 2021 with a percent loss of 24.2% YoY.
Overview
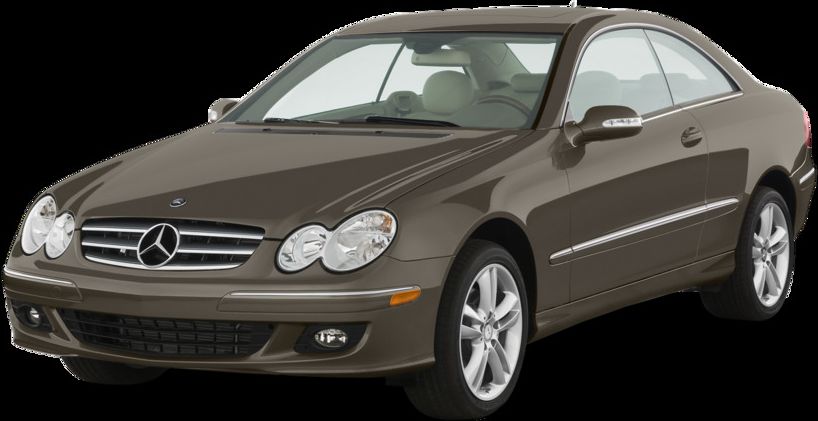
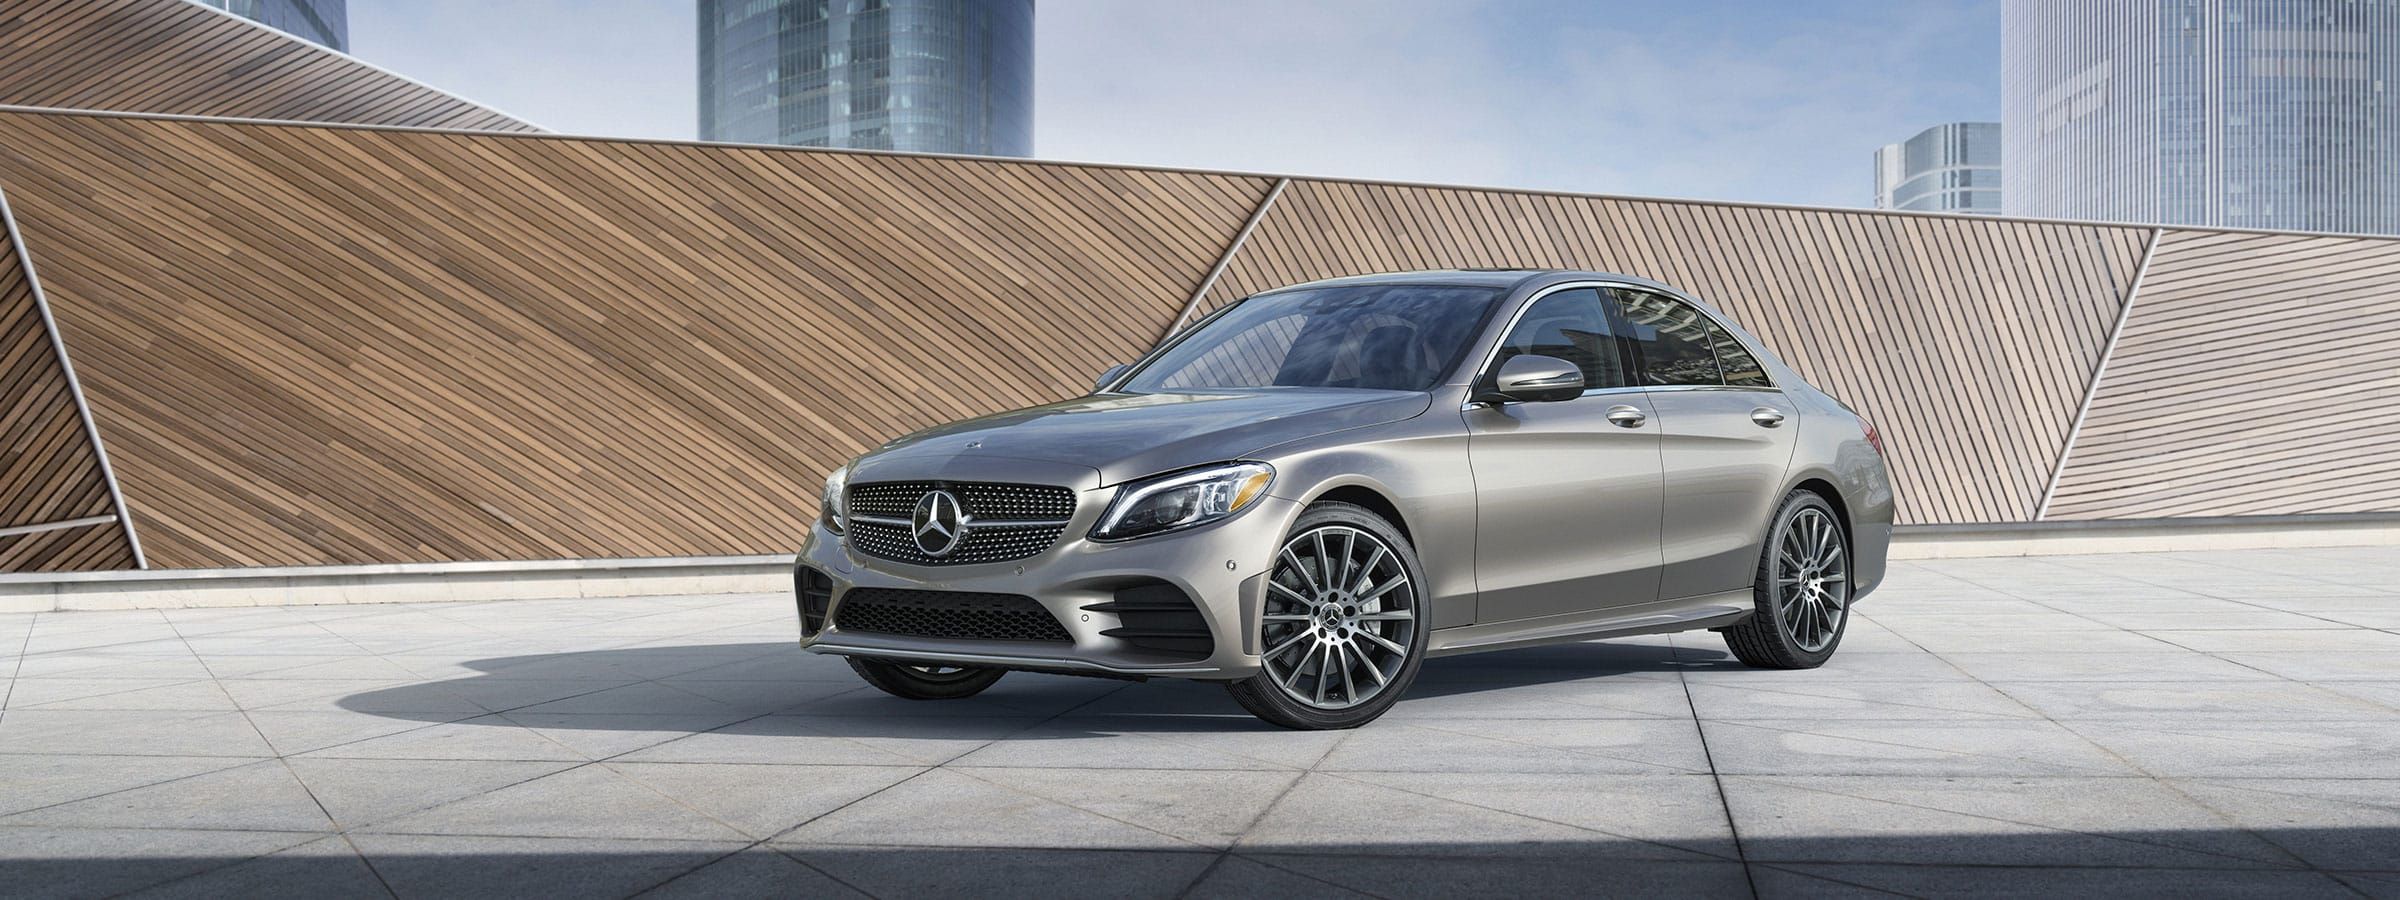
The 2022 Mercedes-Benz C-Class is a vehicle from automaker Mercedes-Benz.
How Much Does the 2022 Mercedes-Benz C-Class Cost?
The 2022 Mercedes-Benz C-Class starts at $52,100 MSRP. Fully loaded, the Mercedes-Benz C-Class will cost you about $75,700.
Mercedes-Benz C-Class Engine, Transmission, and Performance Numbers
Mercedes-Benz C-Class is powered by a all-wheel-drive powertrain that makes 255 horsepower and 273 ft-lb torque.
List of Mercedes-Benz C-Class Competitors
Some of Mercedes-Benz C-Class competitors include the BMW 4-Series, BMW 4-Series, Infiniti Q60, BMW 4-Series, BMW 4-Series, Audi A5, Audi A5 and BMW 4-Series.
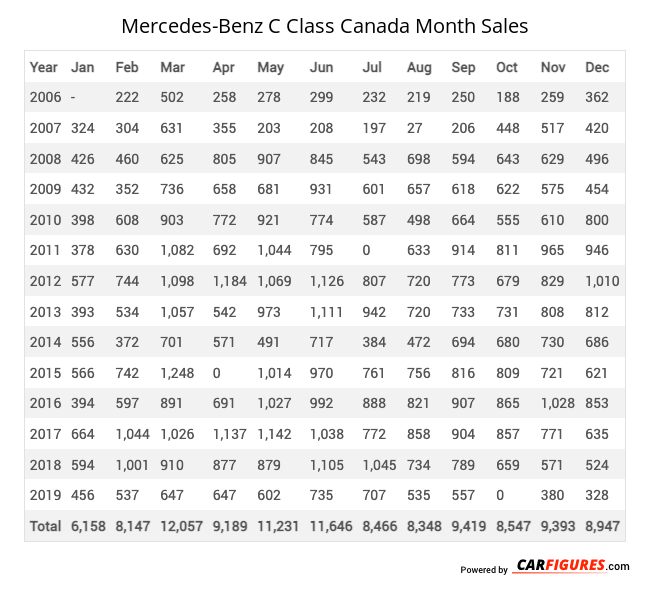
Mercedes-Benz C Class Canadian Sale figures by year, quarter, and month are presented below. Including the most up to date sales data for the Mercedes-Benz C Class. See how the Mercedes-Benz C Class stacks up the other models in the Cars, Premium Compact Cars segments.
Year | Jan | Feb | Mar | Apr | May | Jun | Jul | Aug | Sep | Oct | Nov | Dec |
|---|---|---|---|---|---|---|---|---|---|---|---|---|
| 2006 | - | 222 | 502 | 258 | 278 | 299 | 232 | 219 | 250 | 188 | 259 | 362 |
| 2007 | 324 | 304 | 631 | 355 | 203 | 208 | 197 | 27 | 206 | 448 | 517 | 420 |
| 2008 | 426 | 460 | 625 | 805 | 907 | 845 | 543 | 698 | 594 | 643 | 629 | 496 |
| 2009 | 432 | 352 | 736 | 658 | 681 | 931 | 601 | 657 | 618 | 622 | 575 | 454 |
| 2010 | 398 | 608 | 903 | 772 | 921 | 774 | 587 | 498 | 664 | 555 | 610 | 800 |
| 2011 | 378 | 630 | 1,082 | 692 | 1,044 | 795 | 0 | 633 | 914 | 811 | 965 | 946 |
| 2012 | 577 | 744 | 1,098 | 1,184 | 1,069 | 1,126 | 807 | 720 | 773 | 679 | 829 | 1,010 |
| 2013 | 393 | 534 | 1,057 | 542 | 973 | 1,111 | 942 | 720 | 733 | 731 | 808 | 812 |
| 2014 | 556 | 372 | 701 | 571 | 491 | 717 | 384 | 472 | 694 | 680 | 730 | 686 |
| 2015 | 566 | 742 | 1,248 | 0 | 1,014 | 970 | 761 | 756 | 816 | 809 | 721 | 621 |
| 2016 | 394 | 597 | 891 | 691 | 1,027 | 992 | 888 | 821 | 907 | 865 | 1,028 | 853 |
| 2017 | 664 | 1,044 | 1,026 | 1,137 | 1,142 | 1,038 | 772 | 858 | 904 | 857 | 771 | 635 |
| 2018 | 594 | 1,001 | 910 | 877 | 879 | 1,105 | 1,045 | 734 | 789 | 659 | 571 | 524 |
| 2019 | 456 | 537 | 647 | 647 | 602 | 735 | 707 | 535 | 557 | 0 | 380 | 328 |
| Total | 6,158 | 8,147 | 12,057 | 9,189 | 11,231 | 11,646 | 8,466 | 8,348 | 9,419 | 8,547 | 9,393 | 8,947 |
Year | Q1 | Q2 | Q3 | Q4 |
|---|---|---|---|---|
| 2006 | 724 | 835 | 701 | 809 |
| 2007 | 1,259 | 766 | 430 | 1,385 |
| 2008 | 1,511 | 2,557 | 1,835 | 1,768 |
| 2009 | 1,520 | 2,270 | 1,876 | 1,651 |
| 2010 | 1,909 | 2,467 | 1,749 | 1,965 |
| 2011 | 2,090 | 2,531 | 1,547 | 2,722 |
| 2012 | 2,419 | 3,379 | 2,300 | 2,518 |
| 2013 | 1,984 | 2,626 | 2,395 | 2,351 |
| 2014 | 1,629 | 1,779 | 1,550 | 2,096 |
| 2015 | 2,556 | 1,984 | 2,333 | 2,151 |
| 2016 | 1,882 | 2,710 | 2,616 | 2,746 |
| 2017 | 2,734 | 3,317 | 2,534 | 2,263 |
| 2018 | 2,505 | 2,861 | 2,568 | 1,754 |
| 2019 | 1,640 | 1,984 | 1,799 | 708 |
| 2020 | 684 | 812 | 1,499 | 976 |
| 2021 | 499 | 684 | 1,199 | 628 |
| Total | 27,545 | 33,562 | 28,931 | 28,491 |
Year | Sales |
|---|---|
| 2021 | 3,010 |
| 2020 | 3,971 |
| 2019 | 6,131 |
| 2018 | 9,688 |
| 2017 | 10,848 |
| 2016 | 9,954 |
| 2015 | 9,024 |
| 2014 | 7,054 |
| 2013 | 9,356 |
| 2012 | 10,616 |
| 2011 | 8,890 |
| 2010 | 8,090 |
| 2009 | 7,317 |
| 2008 | 7,671 |
| 2007 | 3,840 |
| 2006 | 3,069 |
| Total | 118,529 |
Download Historic Sales Data

Embedded Code
See more widgetsSources: Manufacturers