Key Stats
How many 4-Series did BMW sell in Q4 2021?
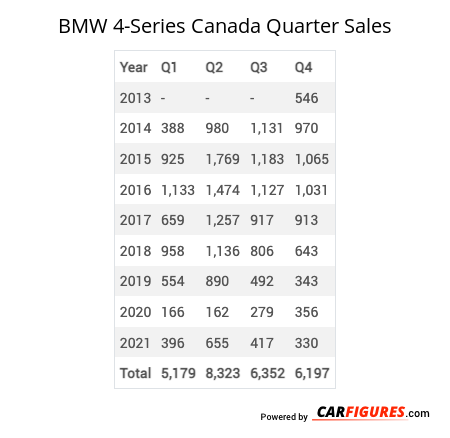
BMW sold 330 4-Series in Q4 2021.
How many 4-Series did BMW sell in 2021?
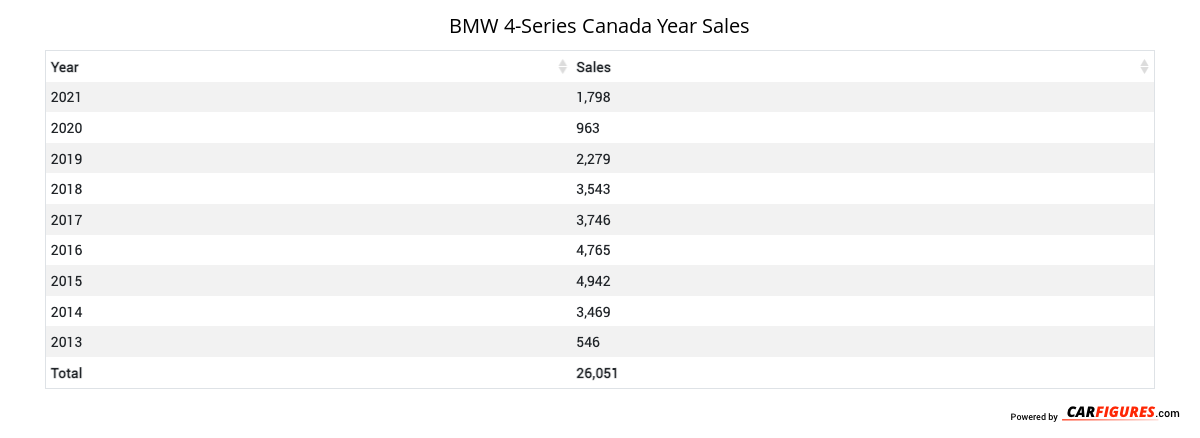
BMW sold 1,798 4-Series in 2021. In 2020, BMW sold 963 4-Series. They sold 835 more units in 2021 compared to 2020 with a percent gain of 86.71% YoY.
Overview
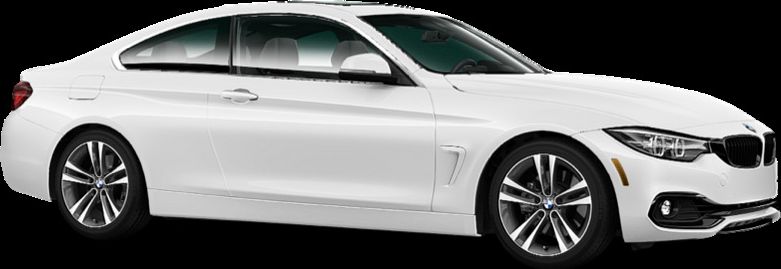
The 2022 BMW 4 Series is a vehicle from automaker BMW.
How Much Does the 2022 BMW 4 Series Cost?
Pricing for the 2022 BMW 4 Series starts at $53,150 MSRP and goes up to $75,900 fully loaded.
BMW 4 Series Engine, Transmission, and Performance Numbers
BMW 4 Series is powered by a all-wheel-drive powertrain that makes 255 horsepower and 295 ft-lb torque.
List of BMW 4 Series Competitors
Some of BMW 4 Series competitors include the Mercedes-Benz C Class, Mercedes-Benz C Class, Infiniti Q60, Audi A5, Mercedes-Benz C Class, Audi A5, Mercedes-Benz C Class and Mercedes-Benz C Class.
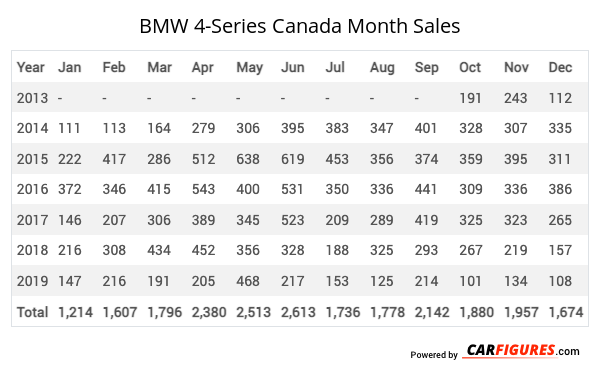
BMW 4-Series Canadian Sale figures by year, quarter, and month are presented below. Including the most up to date sales data for the BMW 4-Series. See how the BMW 4-Series stacks up the other models in the Cars, Premium Sport/Performance Cars segments.
Year | Jan | Feb | Mar | Apr | May | Jun | Jul | Aug | Sep | Oct | Nov | Dec |
|---|---|---|---|---|---|---|---|---|---|---|---|---|
| 2013 | - | - | - | - | - | - | - | - | - | 191 | 243 | 112 |
| 2014 | 111 | 113 | 164 | 279 | 306 | 395 | 383 | 347 | 401 | 328 | 307 | 335 |
| 2015 | 222 | 417 | 286 | 512 | 638 | 619 | 453 | 356 | 374 | 359 | 395 | 311 |
| 2016 | 372 | 346 | 415 | 543 | 400 | 531 | 350 | 336 | 441 | 309 | 336 | 386 |
| 2017 | 146 | 207 | 306 | 389 | 345 | 523 | 209 | 289 | 419 | 325 | 323 | 265 |
| 2018 | 216 | 308 | 434 | 452 | 356 | 328 | 188 | 325 | 293 | 267 | 219 | 157 |
| 2019 | 147 | 216 | 191 | 205 | 468 | 217 | 153 | 125 | 214 | 101 | 134 | 108 |
| Total | 1,214 | 1,607 | 1,796 | 2,380 | 2,513 | 2,613 | 1,736 | 1,778 | 2,142 | 1,880 | 1,957 | 1,674 |
Year | Q1 | Q2 | Q3 | Q4 |
|---|---|---|---|---|
| 2013 | - | - | - | 546 |
| 2014 | 388 | 980 | 1,131 | 970 |
| 2015 | 925 | 1,769 | 1,183 | 1,065 |
| 2016 | 1,133 | 1,474 | 1,127 | 1,031 |
| 2017 | 659 | 1,257 | 917 | 913 |
| 2018 | 958 | 1,136 | 806 | 643 |
| 2019 | 554 | 890 | 492 | 343 |
| 2020 | 166 | 162 | 279 | 356 |
| 2021 | 396 | 655 | 417 | 330 |
| Total | 5,179 | 8,323 | 6,352 | 6,197 |
Year | Sales |
|---|---|
| 2021 | 1,798 |
| 2020 | 963 |
| 2019 | 2,279 |
| 2018 | 3,543 |
| 2017 | 3,746 |
| 2016 | 4,765 |
| 2015 | 4,942 |
| 2014 | 3,469 |
| 2013 | 546 |
| Total | 26,051 |
Download Historic Sales Data
Embedded Code
See more widgetsSources: Manufacturers