Key Stats
How many 3-Series did BMW sell in Q4 2021?
BMW sold 915 3-Series in Q4 2021.
How many 3-Series did BMW sell in 2021?
BMW sold 4,348 3-Series in 2021. In 2020, BMW sold 3,872 3-Series. They sold 476 more units in 2021 compared to 2020 with a percent gain of 12.29% YoY.
Overview
The 2022 BMW 3 Series is a vehicle from automaker BMW.
How Much Does the 2022 BMW 3 Series Cost?
The 2022 BMW 3 Series starts at $44,990 MSRP. Fully loaded, the BMW 3 Series will cost you about $64,000.
BMW 3 Series Engine, Transmission, and Performance Numbers
BMW 3 Series delivers 255 horsepower with 295 ft-lb torque delivered through a rear-wheel-drive drivetrain.
List of BMW 3 Series Competitors
Some of BMW 3 Series competitors include the Genesis G70, Lexus IS, Genesis G70, Mercedes-Benz C Class, Lexus IS, Alfa Romeo Giulia, Audi A4, Genesis G70, Infiniti Q50 and Mercedes-Benz C Class.
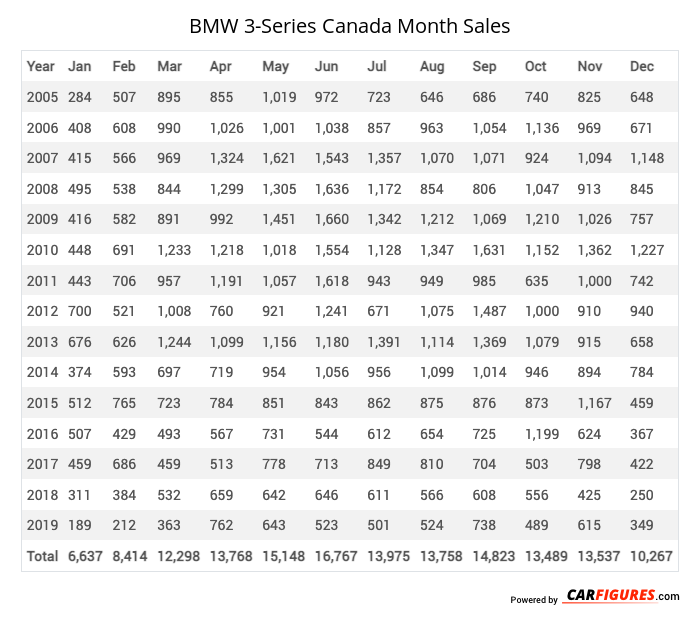
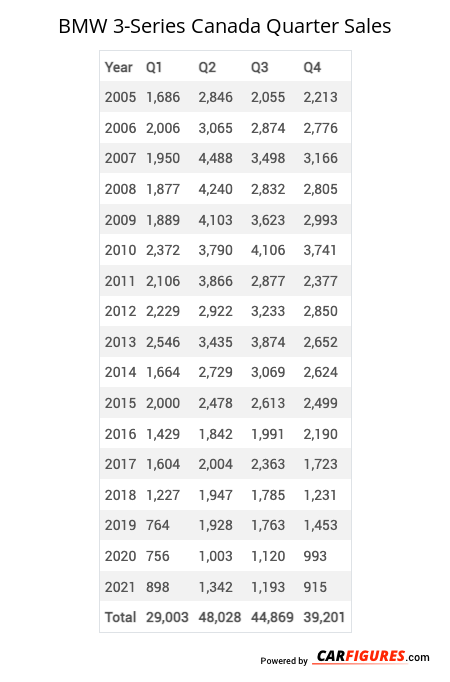
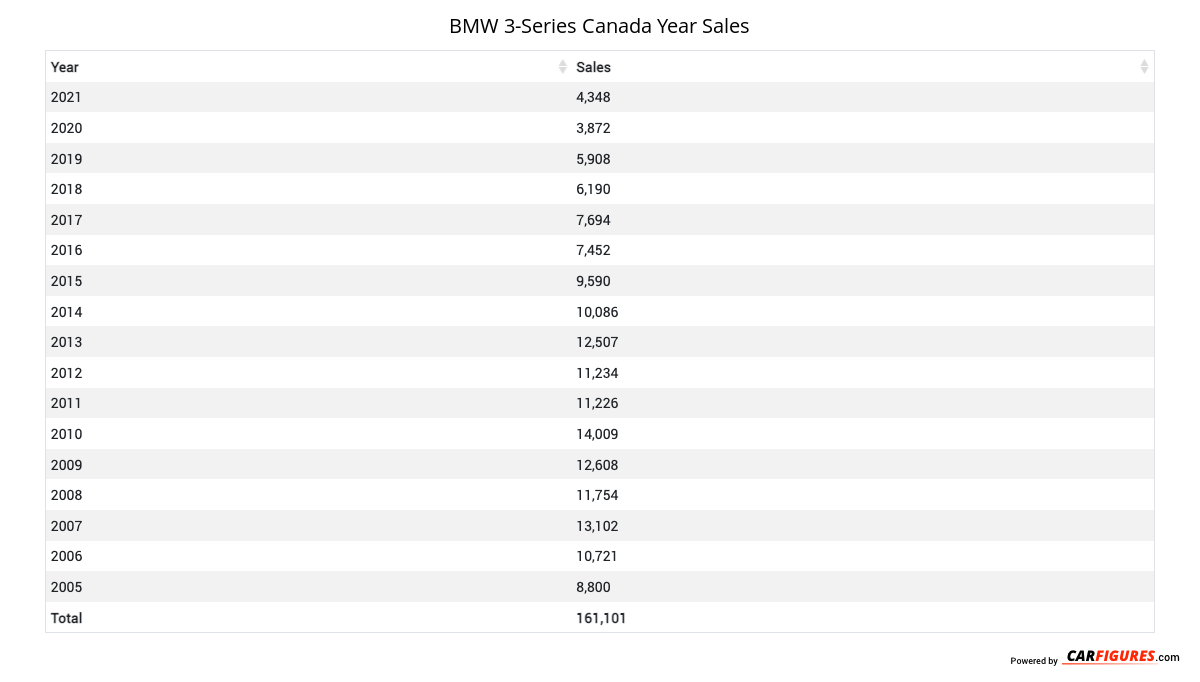
BMW 3-Series Canadian Sale figures by year, quarter, and month are presented below. Including the most up to date sales data for the BMW 3-Series. See how the BMW 3-Series stacks up the other models in the Cars, Premium Compact Cars segments.
Year | Jan | Feb | Mar | Apr | May | Jun | Jul | Aug | Sep | Oct | Nov | Dec |
|---|---|---|---|---|---|---|---|---|---|---|---|---|
| 2005 | 284 | 507 | 895 | 855 | 1,019 | 972 | 723 | 646 | 686 | 740 | 825 | 648 |
| 2006 | 408 | 608 | 990 | 1,026 | 1,001 | 1,038 | 857 | 963 | 1,054 | 1,136 | 969 | 671 |
| 2007 | 415 | 566 | 969 | 1,324 | 1,621 | 1,543 | 1,357 | 1,070 | 1,071 | 924 | 1,094 | 1,148 |
| 2008 | 495 | 538 | 844 | 1,299 | 1,305 | 1,636 | 1,172 | 854 | 806 | 1,047 | 913 | 845 |
| 2009 | 416 | 582 | 891 | 992 | 1,451 | 1,660 | 1,342 | 1,212 | 1,069 | 1,210 | 1,026 | 757 |
| 2010 | 448 | 691 | 1,233 | 1,218 | 1,018 | 1,554 | 1,128 | 1,347 | 1,631 | 1,152 | 1,362 | 1,227 |
| 2011 | 443 | 706 | 957 | 1,191 | 1,057 | 1,618 | 943 | 949 | 985 | 635 | 1,000 | 742 |
| 2012 | 700 | 521 | 1,008 | 760 | 921 | 1,241 | 671 | 1,075 | 1,487 | 1,000 | 910 | 940 |
| 2013 | 676 | 626 | 1,244 | 1,099 | 1,156 | 1,180 | 1,391 | 1,114 | 1,369 | 1,079 | 915 | 658 |
| 2014 | 374 | 593 | 697 | 719 | 954 | 1,056 | 956 | 1,099 | 1,014 | 946 | 894 | 784 |
| 2015 | 512 | 765 | 723 | 784 | 851 | 843 | 862 | 875 | 876 | 873 | 1,167 | 459 |
| 2016 | 507 | 429 | 493 | 567 | 731 | 544 | 612 | 654 | 725 | 1,199 | 624 | 367 |
| 2017 | 459 | 686 | 459 | 513 | 778 | 713 | 849 | 810 | 704 | 503 | 798 | 422 |
| 2018 | 311 | 384 | 532 | 659 | 642 | 646 | 611 | 566 | 608 | 556 | 425 | 250 |
| 2019 | 189 | 212 | 363 | 762 | 643 | 523 | 501 | 524 | 738 | 489 | 615 | 349 |
| Total | 6,637 | 8,414 | 12,298 | 13,768 | 15,148 | 16,767 | 13,975 | 13,758 | 14,823 | 13,489 | 13,537 | 10,267 |
Year | Q1 | Q2 | Q3 | Q4 |
|---|---|---|---|---|
| 2005 | 1,686 | 2,846 | 2,055 | 2,213 |
| 2006 | 2,006 | 3,065 | 2,874 | 2,776 |
| 2007 | 1,950 | 4,488 | 3,498 | 3,166 |
| 2008 | 1,877 | 4,240 | 2,832 | 2,805 |
| 2009 | 1,889 | 4,103 | 3,623 | 2,993 |
| 2010 | 2,372 | 3,790 | 4,106 | 3,741 |
| 2011 | 2,106 | 3,866 | 2,877 | 2,377 |
| 2012 | 2,229 | 2,922 | 3,233 | 2,850 |
| 2013 | 2,546 | 3,435 | 3,874 | 2,652 |
| 2014 | 1,664 | 2,729 | 3,069 | 2,624 |
| 2015 | 2,000 | 2,478 | 2,613 | 2,499 |
| 2016 | 1,429 | 1,842 | 1,991 | 2,190 |
| 2017 | 1,604 | 2,004 | 2,363 | 1,723 |
| 2018 | 1,227 | 1,947 | 1,785 | 1,231 |
| 2019 | 764 | 1,928 | 1,763 | 1,453 |
| 2020 | 756 | 1,003 | 1,120 | 993 |
| 2021 | 898 | 1,342 | 1,193 | 915 |
| Total | 29,003 | 48,028 | 44,869 | 39,201 |
Year | Sales |
|---|---|
| 2021 | 4,348 |
| 2020 | 3,872 |
| 2019 | 5,908 |
| 2018 | 6,190 |
| 2017 | 7,694 |
| 2016 | 7,452 |
| 2015 | 9,590 |
| 2014 | 10,086 |
| 2013 | 12,507 |
| 2012 | 11,234 |
| 2011 | 11,226 |
| 2010 | 14,009 |
| 2009 | 12,608 |
| 2008 | 11,754 |
| 2007 | 13,102 |
| 2006 | 10,721 |
| 2005 | 8,800 |
| Total | 161,101 |
Download Historic Sales Data
Embedded Code
See more widgetsSources: Manufacturers