Last updated: January 03, 2025
Overview
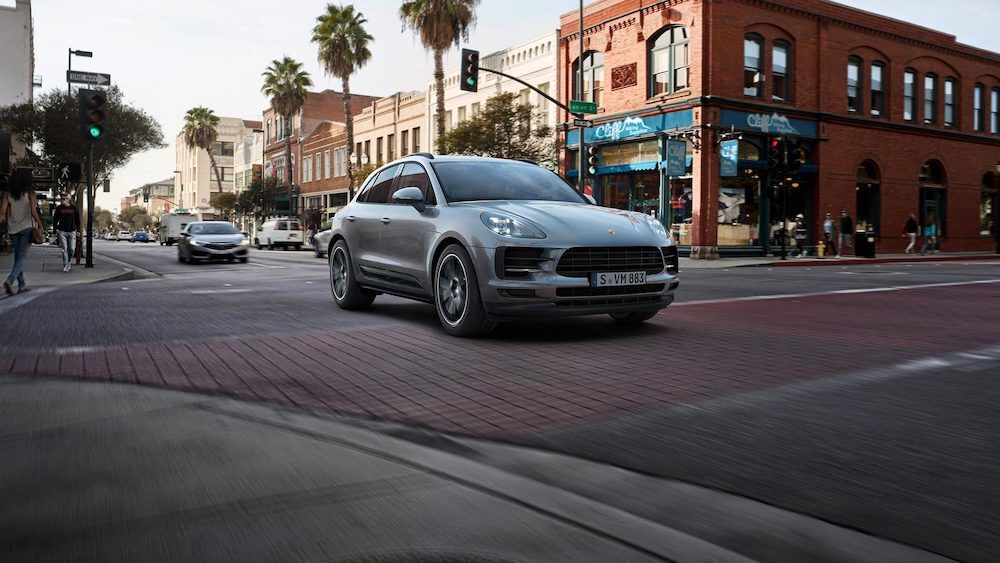
The 2024 Porsche Macan is a vehicle from automaker Porsche.
How Much Does the 2024 Porsche Macan Cost?
The 2024 Porsche Macan starts at $66,500 MSRP. Fully loaded, the Porsche Macan will cost you about $86,800.
Porsche Macan Engine, Transmission, and Performance Numbers
Porsche Macan includes a 2.0-liter engine combined with a 7-Speed Porsche Doppelkupplung (PDK). This delivers 261 hp with 295 lb-ft torque delivered through a All Wheel Drive drivetrain.
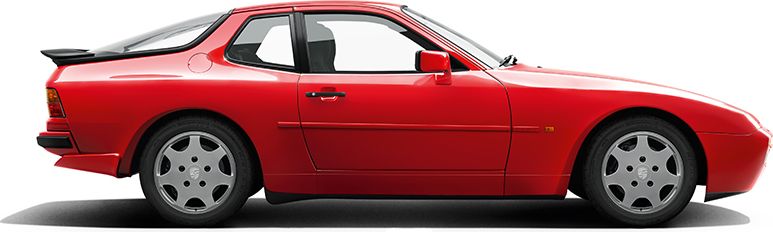
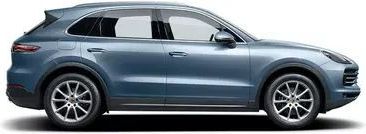
List of Porsche Macan Competitors
Some of Porsche Macan competitors include the Porsche Cayenne, Audi Q5 and BMW X3.
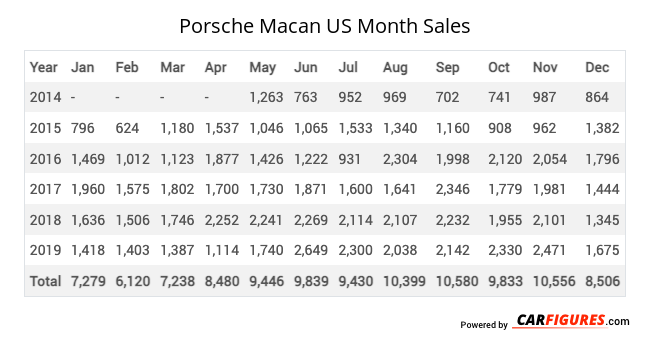
Porsche Macan United States Sale figures by year, quarter, and month are presented below. Including the most up to date sales data for the Porsche Macan. See how the Porsche Macan stacks up the other models in the Crossover/SUVS, Premium Compact Crossover/SUVs segments.
For sales numbers of the Porsche Macan in Canada, click here.
Loading, please wait
Year | Jan | Feb | Mar | Apr | May | Jun | Jul | Aug | Sep | Oct | Nov | Dec |
|---|---|---|---|---|---|---|---|---|---|---|---|---|
| 2014 | - | - | - | - | 1,263 | 763 | 952 | 969 | 702 | 741 | 987 | 864 |
| 2015 | 796 | 624 | 1,180 | 1,537 | 1,046 | 1,065 | 1,533 | 1,340 | 1,160 | 908 | 962 | 1,382 |
| 2016 | 1,469 | 1,012 | 1,123 | 1,877 | 1,426 | 1,222 | 931 | 2,304 | 1,998 | 2,120 | 2,054 | 1,796 |
| 2017 | 1,960 | 1,575 | 1,802 | 1,700 | 1,730 | 1,871 | 1,600 | 1,641 | 2,346 | 1,779 | 1,981 | 1,444 |
| 2018 | 1,636 | 1,506 | 1,746 | 2,252 | 2,241 | 2,269 | 2,114 | 2,107 | 2,232 | 1,955 | 2,101 | 1,345 |
| 2019 | 1,418 | 1,403 | 1,387 | 1,114 | 1,740 | 2,649 | 2,300 | 2,038 | 2,142 | 2,330 | 2,471 | 1,675 |
| Total | 7,279 | 6,120 | 7,238 | 8,480 | 9,446 | 9,839 | 9,430 | 10,399 | 10,580 | 9,833 | 10,556 | 8,506 |
Loading, please wait
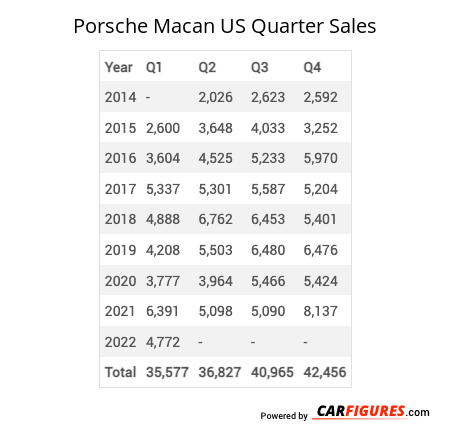
Year | Q1 | Q2 | Q3 | Q4 |
|---|---|---|---|---|
| 2014 | - | 2,026 | 2,623 | 2,592 |
| 2015 | 2,600 | 3,648 | 4,033 | 3,252 |
| 2016 | 3,604 | 4,525 | 5,233 | 5,970 |
| 2017 | 5,337 | 5,301 | 5,587 | 5,204 |
| 2018 | 4,888 | 6,762 | 6,453 | 5,401 |
| 2019 | 4,208 | 5,503 | 6,480 | 6,476 |
| 2020 | 3,777 | 3,964 | 5,466 | 5,424 |
| 2021 | 6,391 | 5,098 | 5,090 | 8,137 |
| 2022 | 4,772 | 5,910 | 5,271 | 0 |
| 2023 | 0 | 0 | 0 | 0 |
| 2024 | 0 | 0 | 0 | 0 |
| 2025 | - | - | - | - |
| Total | 35,577 | 42,737 | 46,236 | 42,456 |
Loading, please wait
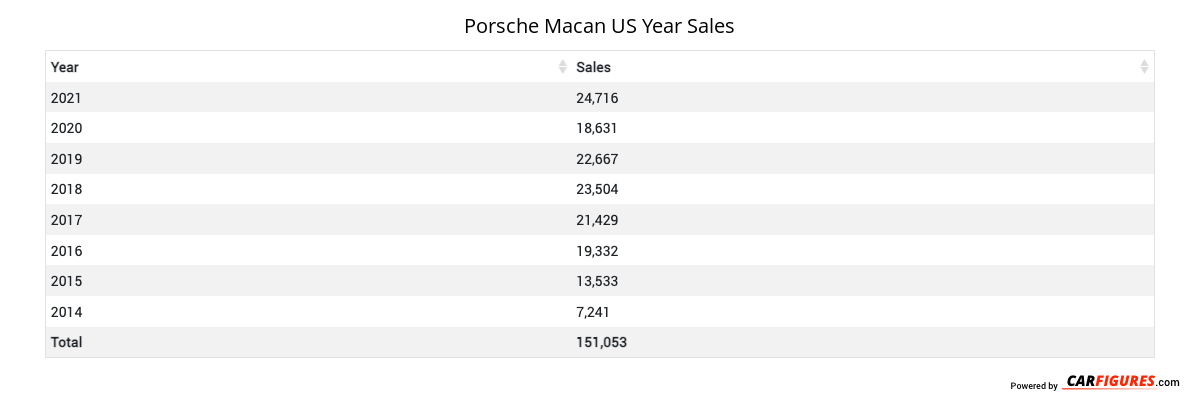
Year | Sales |
|---|---|
| 2022 | 15,953 |
| 2021 | 24,716 |
| 2020 | 18,631 |
| 2019 | 22,667 |
| 2018 | 23,504 |
| 2017 | 21,429 |
| 2016 | 19,332 |
| 2015 | 13,533 |
| 2014 | 7,241 |
| Total | 167,006 |
Download Historic Sales Data
Embedded Code
See more widgetsSources: Manufacturers