Last updated: October 03, 2022
Porsche Total US Sales Statistics by Year
Porsche Total US Sales Statistics by Quarter
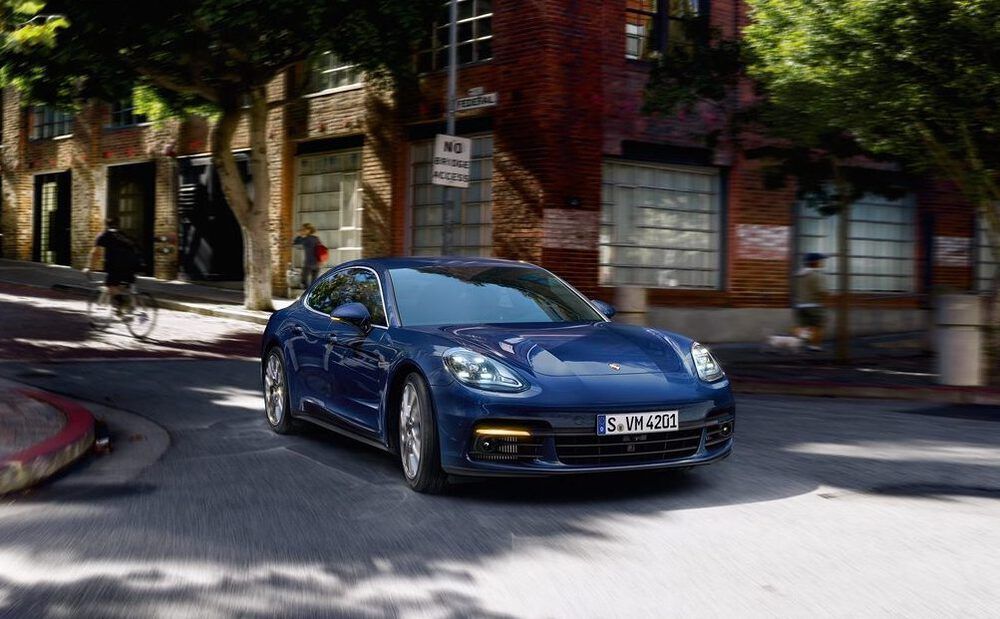
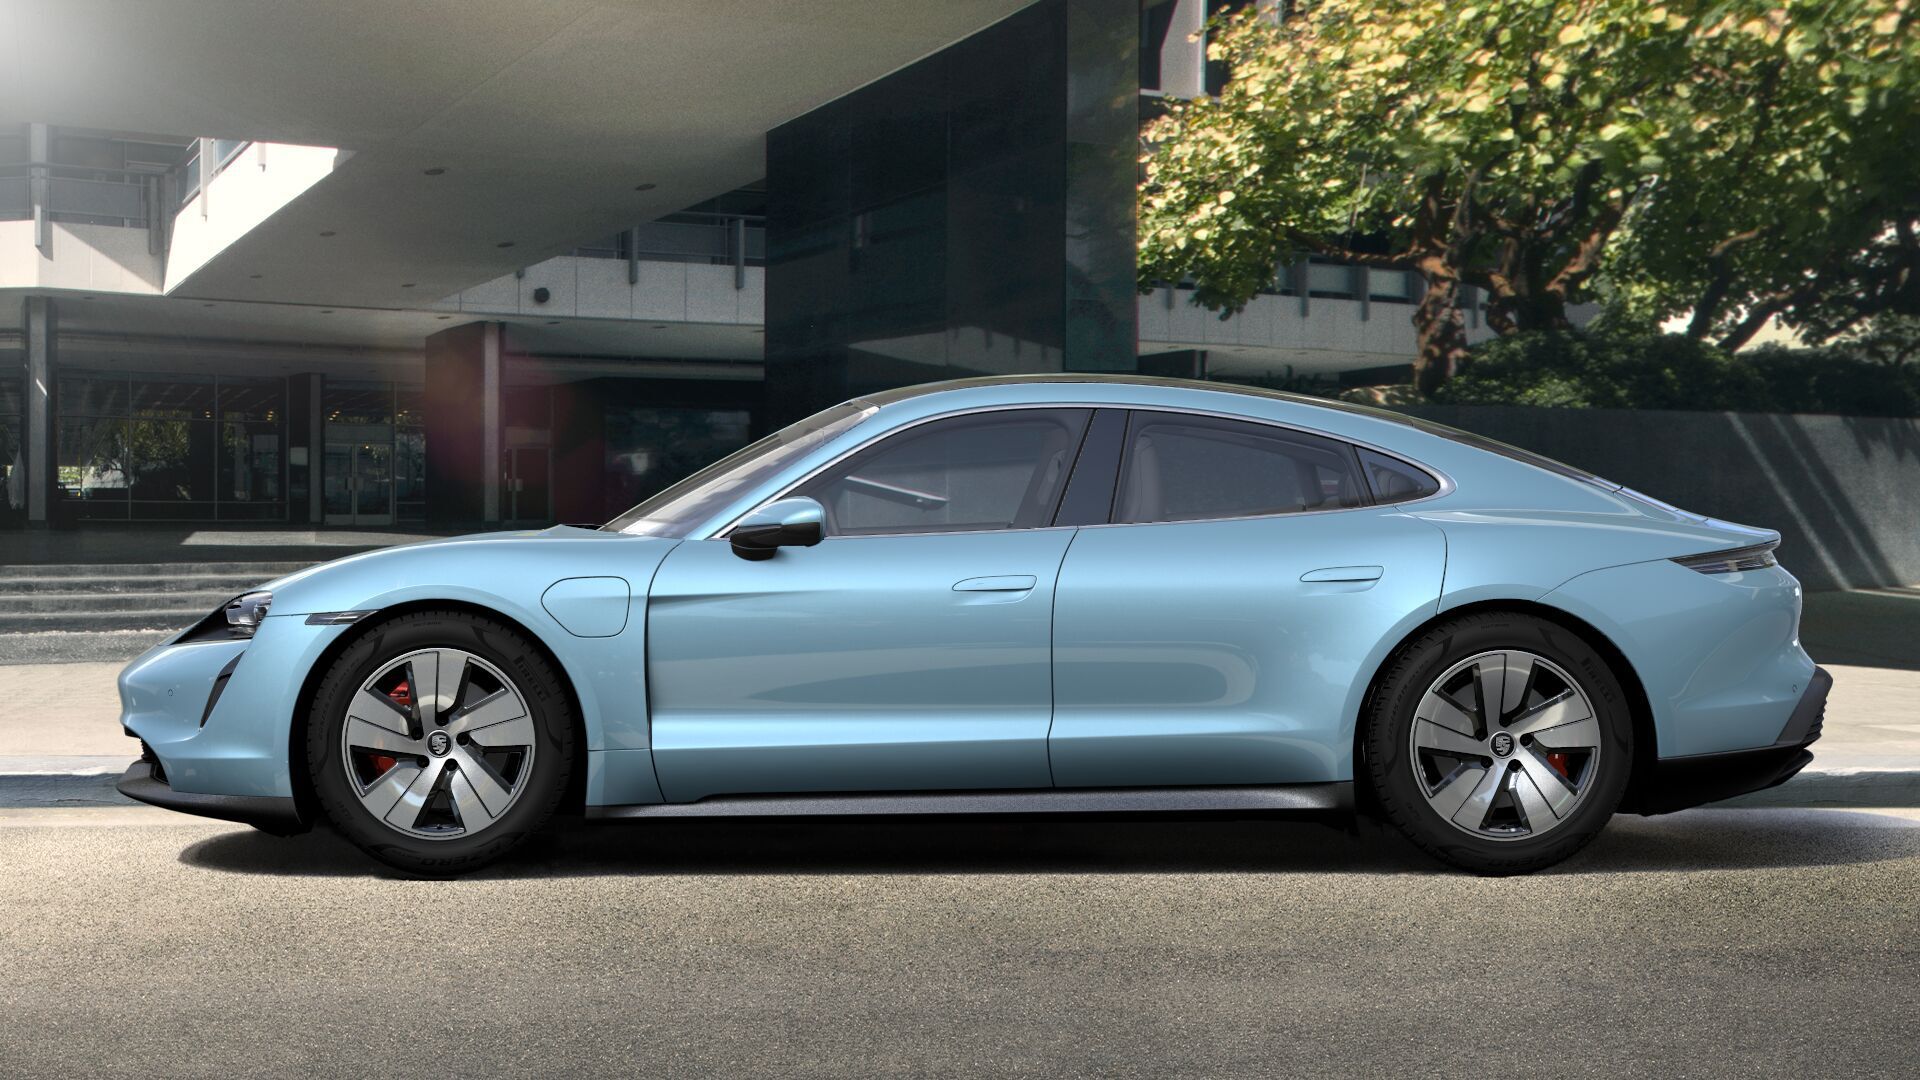
Current Lineup


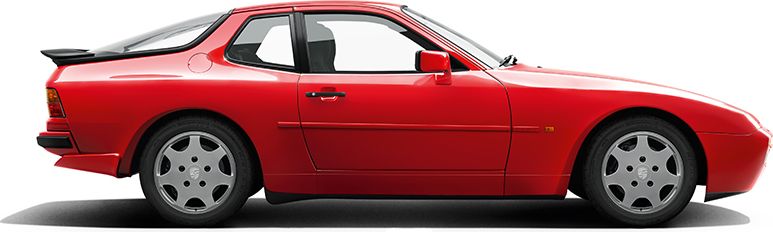
Discontinued Models


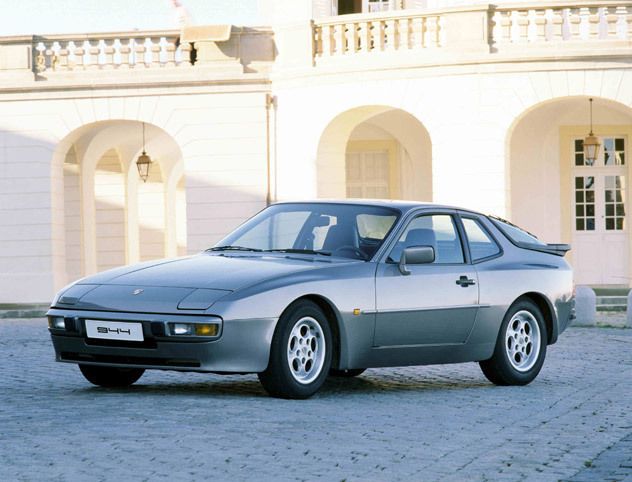


Porsche includes the cars 2024 718, 2024 911, 2015 918 Spyder, 1995 928, 1991 944, 1995 968, 2016 Boxster, 2005 Carrera GT, 2024 Cayenne, 2016 Cayman, 2024 Macan, 2024 Panamera, 2024 Taycan
Loading, please wait
Year | Q1 | Q2 | Q3 | Q4 |
|---|---|---|---|---|
| 2005 | 5,467 | 6,179 | 5,738 | 6,670 |
| 2006 | 5,869 | 6,316 | 5,115 | 5,399 |
| 2007 | 6,016 | 6,919 | 5,779 | 6,330 |
| 2008 | 5,136 | 6,001 | 4,420 | 4,158 |
| 2009 | 3,894 | 4,671 | 3,629 | 4,644 |
| 2010 | 4,528 | 4,127 | 5,845 | 6,934 |
| 2011 | 6,182 | 7,520 | 6,270 | 5,901 |
| 2012 | 6,776 | 8,649 | 7,547 | 8,708 |
| 2013 | 8,287 | 9,090 | 7,982 | 9,011 |
| 2014 | 8,281 | 10,751 | 10,002 | 9,941 |
| 2015 | 11,126 | 13,708 | 14,162 | 12,456 |
| 2016 | 12,238 | 15,157 | 15,165 | 15,305 |
| 2017 | 13,824 | 16,218 | 15,060 | 15,405 |
| 2018 | 15,306 | 17,167 | 14,453 | 15,552 |
| 2019 | 15,024 | 15,233 | 14,805 | 16,376 |
| 2020 | 11,994 | 12,192 | 15,548 | 17,560 |
| 2021 | 17,368 | 18,958 | 15,289 | 18,410 |
| 2022 | 13,051 | 19,489 | 16,580 | - |
Loading, please wait
Year | Sales |
|---|---|
| 2022 | 49,120 |
| 2021 | 70,025 |
| 2020 | 57,294 |
| 2019 | 61,438 |
| 2018 | 62,478 |
| 2017 | 60,507 |
| 2016 | 57,865 |
| 2015 | 51,452 |
| 2014 | 38,975 |
| 2013 | 34,370 |
| 2012 | 31,680 |
| 2011 | 25,873 |
| 2010 | 21,434 |
| 2009 | 16,838 |
| 2008 | 19,715 |
| 2007 | 25,044 |
| 2006 | 22,699 |
| 2005 | 24,054 |
| Total | 730,861 |