Key Stats
How many Q5 did Audi sell in 2024?
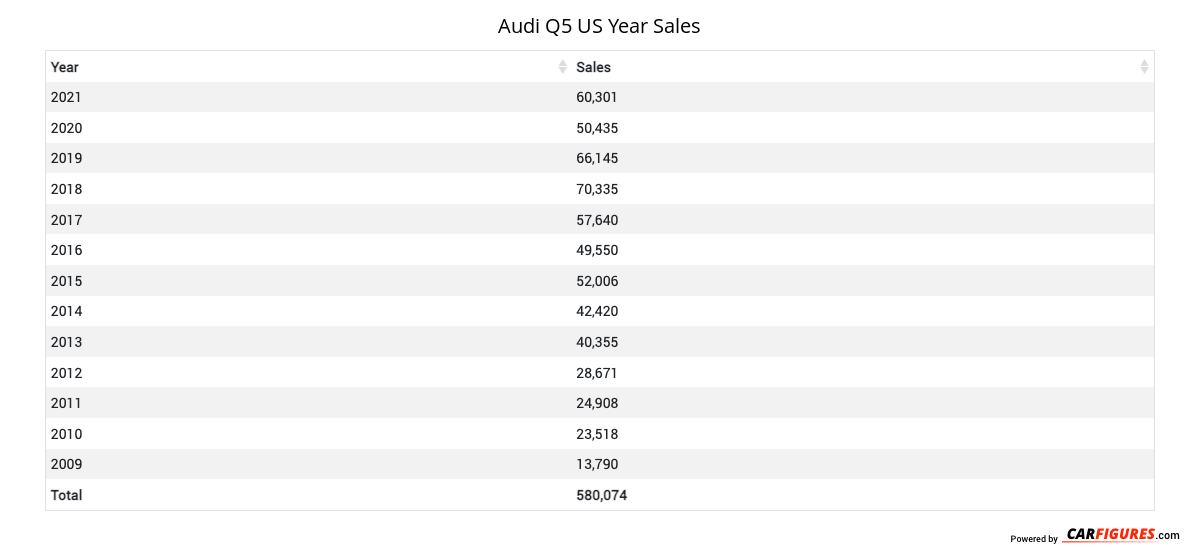
Audi sold 39,249 Q5 in 2024. In 2023, Audi sold 54,778 Q5. They sold 15,529 more units in year 2023 compared to 2024 with a percent loss of 28.35% YoY.
Overview
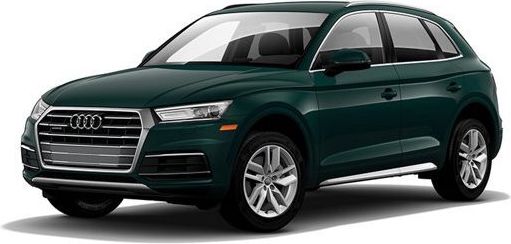
The 2022 Audi Q5 is a vehicle from automaker Audi.
How Much Does the 2022 Audi Q5 Cost?
Pricing for the 2022 Audi Q5 starts at $45,600 MSRP and goes up to $49,900 fully loaded.
Audi Q5 Engine, Transmission, and Performance Numbers
Audi Q5 is powered by a 2.0-liter engine with a All Wheel Drive powertrain that makes 261 -hp and 273 lb-ft torque. The transmission on the Audi Q5 is an 7-Speed S tronic Dual-Clutch Auto.
List of Audi Q5 Competitors
Some of Audi Q5 competitors include the BMW X3, Audi Q3 and Audi Q7.
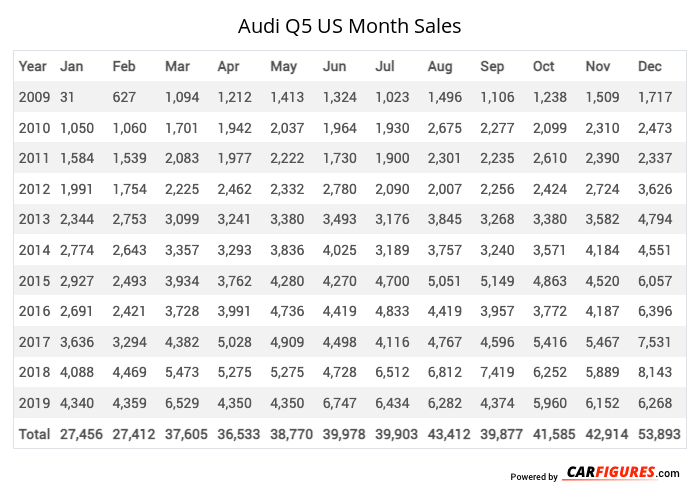
Audi Q5 United States Sale figures by year, quarter, and month are presented below. Including the most up to date sales data for the Audi Q5. See how the Audi Q5 stacks up the other models in the Crossover/SUVS, Premium Compact Crossover/SUVs segments.
*Sales report includes Q5, SQ5
Year | Jan | Feb | Mar | Apr | May | Jun | Jul | Aug | Sep | Oct | Nov | Dec |
|---|---|---|---|---|---|---|---|---|---|---|---|---|
| 2009 | 31 | 627 | 1,094 | 1,212 | 1,413 | 1,324 | 1,023 | 1,496 | 1,106 | 1,238 | 1,509 | 1,717 |
| 2010 | 1,050 | 1,060 | 1,701 | 1,942 | 2,037 | 1,964 | 1,930 | 2,675 | 2,277 | 2,099 | 2,310 | 2,473 |
| 2011 | 1,584 | 1,539 | 2,083 | 1,977 | 2,222 | 1,730 | 1,900 | 2,301 | 2,235 | 2,610 | 2,390 | 2,337 |
| 2012 | 1,991 | 1,754 | 2,225 | 2,462 | 2,332 | 2,780 | 2,090 | 2,007 | 2,256 | 2,424 | 2,724 | 3,626 |
| 2013 | 2,344 | 2,753 | 3,099 | 3,241 | 3,380 | 3,493 | 3,176 | 3,845 | 3,268 | 3,380 | 3,582 | 4,794 |
| 2014 | 2,774 | 2,643 | 3,357 | 3,293 | 3,836 | 4,025 | 3,189 | 3,757 | 3,240 | 3,571 | 4,184 | 4,551 |
| 2015 | 2,927 | 2,493 | 3,934 | 3,762 | 4,280 | 4,270 | 4,700 | 5,051 | 5,149 | 4,863 | 4,520 | 6,057 |
| 2016 | 2,691 | 2,421 | 3,728 | 3,991 | 4,736 | 4,419 | 4,833 | 4,419 | 3,957 | 3,772 | 4,187 | 6,396 |
| 2017 | 3,636 | 3,294 | 4,382 | 5,028 | 4,909 | 4,498 | 4,116 | 4,767 | 4,596 | 5,416 | 5,467 | 7,531 |
| 2018 | 4,088 | 4,469 | 5,473 | 5,275 | 5,275 | 4,728 | 6,512 | 6,812 | 7,419 | 6,252 | 5,889 | 8,143 |
| 2019 | 4,340 | 4,359 | 6,529 | 4,350 | 4,350 | 6,747 | 6,434 | 6,282 | 4,374 | 5,960 | 6,152 | 6,268 |
| Total | 27,456 | 27,412 | 37,605 | 36,533 | 38,770 | 39,978 | 39,903 | 43,412 | 39,877 | 41,585 | 42,914 | 53,893 |
Year | Q1 | Q2 | Q3 | Q4 |
|---|---|---|---|---|
| 2009 | 1,752 | 3,949 | 3,625 | 4,464 |
| 2010 | 3,811 | 5,943 | 6,882 | 6,882 |
| 2011 | 5,206 | 5,929 | 6,436 | 7,337 |
| 2012 | 5,970 | 7,574 | 6,353 | 8,774 |
| 2013 | 8,196 | 10,114 | 10,289 | 11,756 |
| 2014 | 8,774 | 11,154 | 10,186 | 12,306 |
| 2015 | 9,354 | 12,312 | 14,900 | 15,440 |
| 2016 | 8,840 | 13,146 | 13,209 | 14,355 |
| 2017 | 11,312 | 14,435 | 13,479 | 18,414 |
| 2018 | 14,030 | 15,278 | 20,743 | 20,284 |
| 2019 | 15,228 | 15,447 | 17,090 | 18,380 |
| 2020 | 9,959 | 8,072 | 11,339 | 21,065 |
| 2021 | 14,731 | 18,835 | 16,354 | 10,381 |
| 2022 | 10,368 | 15,621 | 11,284 | 19,780 |
| 2023 | 17,085 | 18,255 | 0 | 19,438 |
| 2024 | 11,473 | 13,099 | 14,677 | 0 |
| 2025 | - | - | - | - |
| Total | 156,089 | 189,163 | 176,846 | 209,056 |
Year | Sales |
|---|---|
| 2024 | 39,249 |
| 2023 | 54,778 |
| 2022 | 57,053 |
| 2021 | 60,301 |
| 2020 | 50,435 |
| 2019 | 66,145 |
| 2018 | 70,335 |
| 2017 | 57,640 |
| 2016 | 49,550 |
| 2015 | 52,006 |
| 2014 | 42,420 |
| 2013 | 40,355 |
| 2012 | 28,671 |
| 2011 | 24,908 |
| 2010 | 23,518 |
| 2009 | 13,790 |
| Total | 731,154 |
Download Historic Sales Data

Embedded Code
See more widgetsSources: Manufacturers