Last updated: January 03, 2025

Key Stats
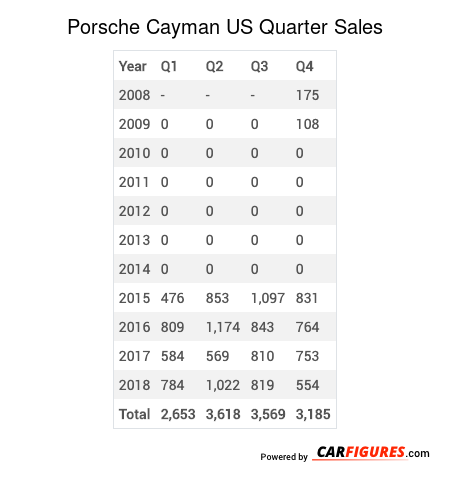
How many Cayman did Porsche sell in Q4 2018?
Porsche sold 554 Cayman in Q4 2018.
Overview
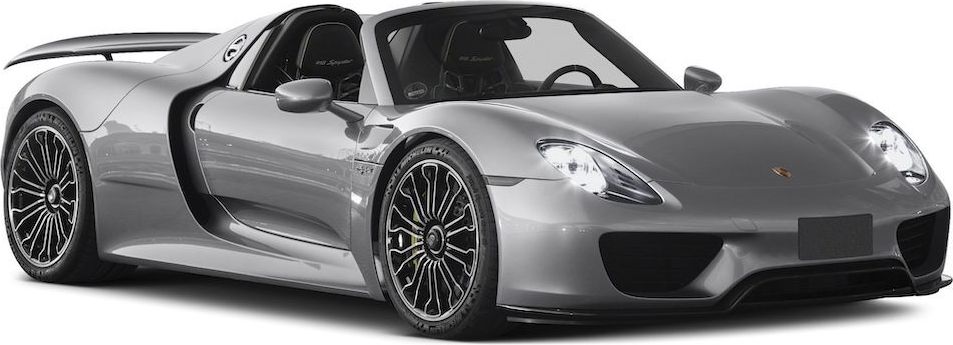
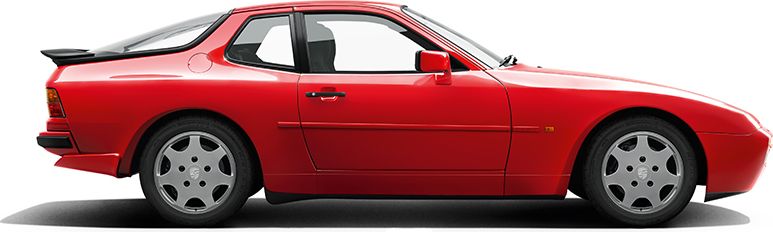
The Porsche Cayman is a Coupe with room for 2 people from automaker Porsche.
Porsche Cayman Engine, Transmission, and Performance Numbers
The Porsche Cayman includes a 2.7-liter H-6 coupled with a that delivers 275 hp and torque with a RWD drivetrain.
2016 Porsche Cayman Fuel Economy
The 2016 Porsche Cayman is expected to get 24 mpg combined.
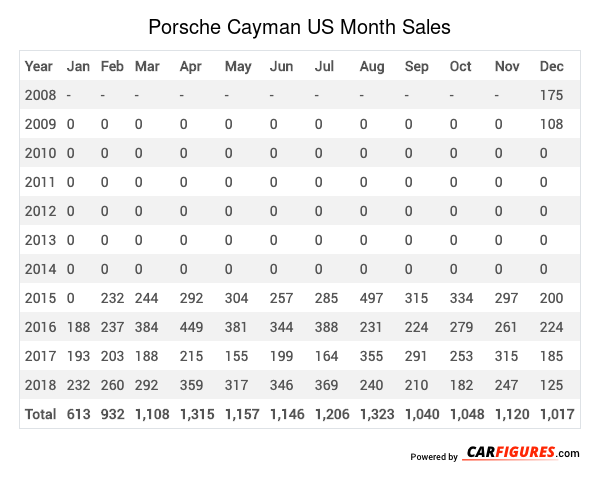
Porsche Cayman United States Sale figures by year, quarter, and month are presented below. Including the most up to date sales data for the Porsche Cayman. See how the Porsche Cayman stacks up the other models in the Cars, Premium Sport/Performance Cars segments.
For sales numbers of the Porsche Cayman in Canada, click here.
Loading, please wait
Year | Jan | Feb | Mar | Apr | May | Jun | Jul | Aug | Sep | Oct | Nov | Dec |
|---|---|---|---|---|---|---|---|---|---|---|---|---|
| 2008 | - | - | - | - | - | - | - | - | - | - | - | 175 |
| 2009 | 0 | 0 | 0 | 0 | 0 | 0 | 0 | 0 | 0 | 0 | 0 | 108 |
| 2010 | 0 | 0 | 0 | 0 | 0 | 0 | 0 | 0 | 0 | 0 | 0 | 0 |
| 2011 | 0 | 0 | 0 | 0 | 0 | 0 | 0 | 0 | 0 | 0 | 0 | 0 |
| 2012 | 0 | 0 | 0 | 0 | 0 | 0 | 0 | 0 | 0 | 0 | 0 | 0 |
| 2013 | 0 | 0 | 0 | 0 | 0 | 0 | 0 | 0 | 0 | 0 | 0 | 0 |
| 2014 | 0 | 0 | 0 | 0 | 0 | 0 | 0 | 0 | 0 | 0 | 0 | 0 |
| 2015 | 0 | 232 | 244 | 292 | 304 | 257 | 285 | 497 | 315 | 334 | 297 | 200 |
| 2016 | 188 | 237 | 384 | 449 | 381 | 344 | 388 | 231 | 224 | 279 | 261 | 224 |
| 2017 | 193 | 203 | 188 | 215 | 155 | 199 | 164 | 355 | 291 | 253 | 315 | 185 |
| 2018 | 232 | 260 | 292 | 359 | 317 | 346 | 369 | 240 | 210 | 182 | 247 | 125 |
| Total | 613 | 932 | 1,108 | 1,315 | 1,157 | 1,146 | 1,206 | 1,323 | 1,040 | 1,048 | 1,120 | 1,017 |
Loading, please wait
Year | Q1 | Q2 | Q3 | Q4 |
|---|---|---|---|---|
| 2008 | - | - | - | 175 |
| 2009 | 0 | 0 | 0 | 108 |
| 2010 | 0 | 0 | 0 | 0 |
| 2011 | 0 | 0 | 0 | 0 |
| 2012 | 0 | 0 | 0 | 0 |
| 2013 | 0 | 0 | 0 | 0 |
| 2014 | 0 | 0 | 0 | 0 |
| 2015 | 476 | 853 | 1,097 | 831 |
| 2016 | 809 | 1,174 | 843 | 764 |
| 2017 | 584 | 569 | 810 | 753 |
| 2018 | 784 | 1,022 | 819 | 554 |
| Total | 2,653 | 3,618 | 3,569 | 3,185 |
Loading, please wait
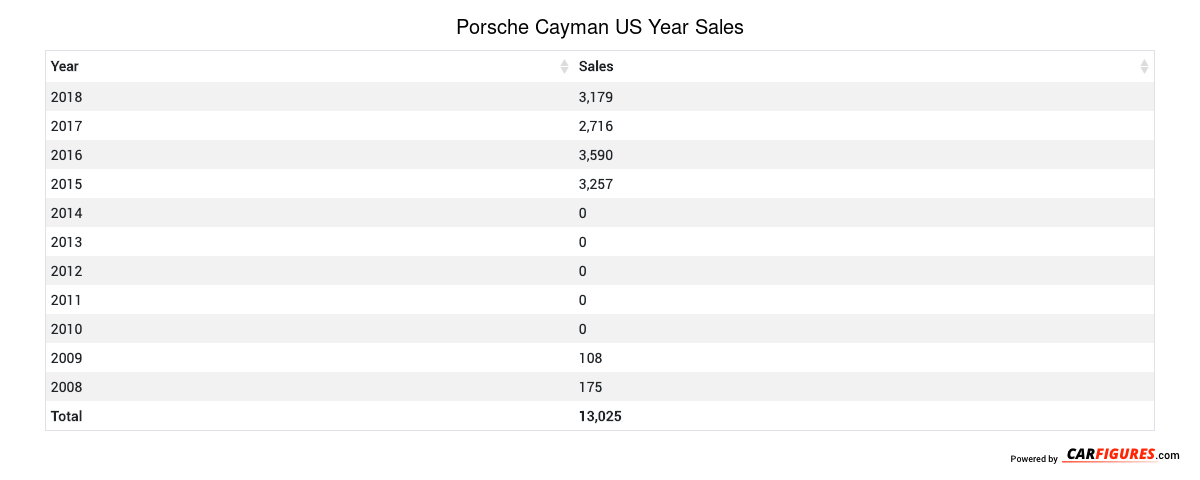
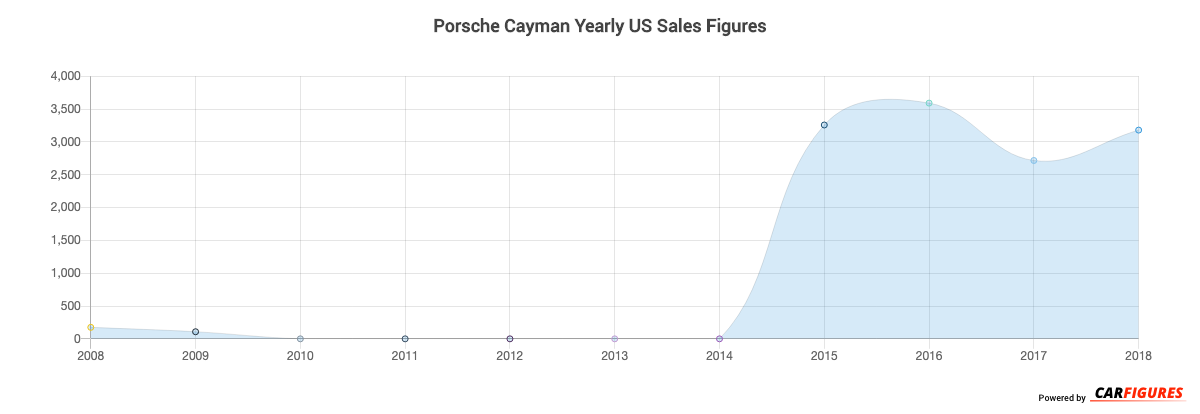
Year | Sales |
|---|---|
| 2018 | 3,179 |
| 2017 | 2,716 |
| 2016 | 3,590 |
| 2015 | 3,257 |
| 2014 | 0 |
| 2013 | 0 |
| 2012 | 0 |
| 2011 | 0 |
| 2010 | 0 |
| 2009 | 108 |
| 2008 | 175 |
| Total | 13,025 |
Download Historic Sales Data

Embedded Code
See more widgetsSources: Manufacturers