
Overview
The 2024 Mercedes-Benz GLA 250 is a vehicle from automaker Mercedes-Benz.
How Much Does the 2024 Mercedes-Benz GLA 250 Cost?
Pricing for the 2024 Mercedes-Benz GLA 250 starts at $42,150 MSRP and goes up to $44,150 fully loaded.
Mercedes-Benz GLA 250 Engine, Transmission, and Performance Numbers
Mercedes-Benz GLA 250 is powered by a 2.0-liter engine with a Front Wheel Drive powertrain that makes 221 -hp and 258 lb-ft torque. The transmission on the Mercedes-Benz GLA 250 is an 8-Speed Dual Clutch (DCT).
List of Mercedes-Benz GLA 250 Competitors
Some of Mercedes-Benz GLA 250 competitors include the Mercedes-Benz GLB-Class, BMW X1 and Audi Q3.
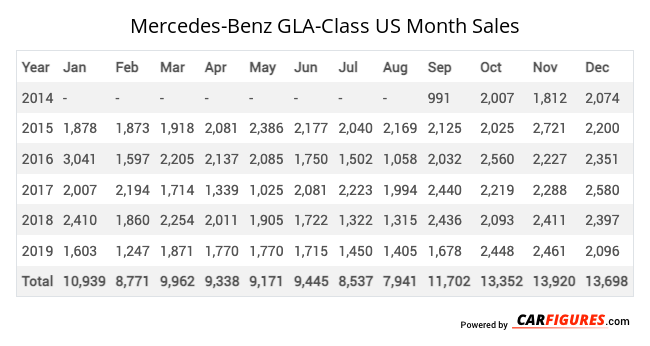
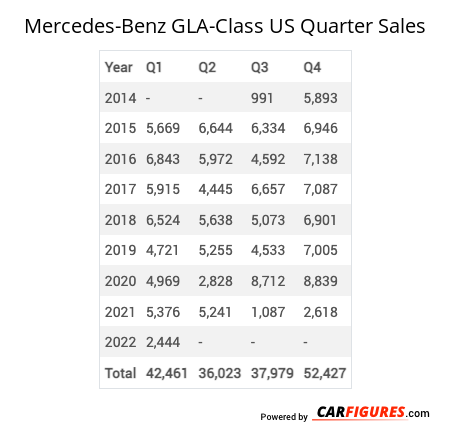
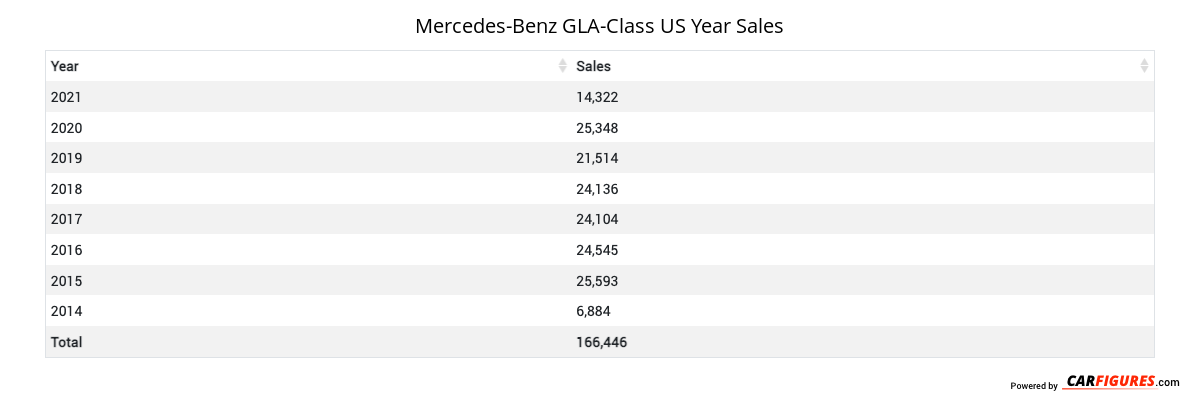
Mercedes-Benz GLA-Class United States Sale figures by year, quarter, and month are presented below. Including the most up to date sales data for the Mercedes-Benz GLA-Class. See how the Mercedes-Benz GLA-Class stacks up the other models in the Crossover/SUVS, Premium Subcompact Crossover/SUVs segments.
Year | Jan | Feb | Mar | Apr | May | Jun | Jul | Aug | Sep | Oct | Nov | Dec |
|---|---|---|---|---|---|---|---|---|---|---|---|---|
| 2014 | - | - | - | - | - | - | - | - | 991 | 2,007 | 1,812 | 2,074 |
| 2015 | 1,878 | 1,873 | 1,918 | 2,081 | 2,386 | 2,177 | 2,040 | 2,169 | 2,125 | 2,025 | 2,721 | 2,200 |
| 2016 | 3,041 | 1,597 | 2,205 | 2,137 | 2,085 | 1,750 | 1,502 | 1,058 | 2,032 | 2,560 | 2,227 | 2,351 |
| 2017 | 2,007 | 2,194 | 1,714 | 1,339 | 1,025 | 2,081 | 2,223 | 1,994 | 2,440 | 2,219 | 2,288 | 2,580 |
| 2018 | 2,410 | 1,860 | 2,254 | 2,011 | 1,905 | 1,722 | 1,322 | 1,315 | 2,436 | 2,093 | 2,411 | 2,397 |
| 2019 | 1,603 | 1,247 | 1,871 | 1,770 | 1,770 | 1,715 | 1,450 | 1,405 | 1,678 | 2,448 | 2,461 | 2,096 |
| Total | 10,939 | 8,771 | 9,962 | 9,338 | 9,171 | 9,445 | 8,537 | 7,941 | 11,702 | 13,352 | 13,920 | 13,698 |
Year | Q1 | Q2 | Q3 | Q4 |
|---|---|---|---|---|
| 2014 | - | - | 991 | 5,893 |
| 2015 | 5,669 | 6,644 | 6,334 | 6,946 |
| 2016 | 6,843 | 5,972 | 4,592 | 7,138 |
| 2017 | 5,915 | 4,445 | 6,657 | 7,087 |
| 2018 | 6,524 | 5,638 | 5,073 | 6,901 |
| 2019 | 4,721 | 5,255 | 4,533 | 7,005 |
| 2020 | 4,969 | 2,828 | 8,712 | 8,839 |
| 2021 | 5,376 | 5,241 | 1,087 | 2,618 |
| 2022 | 2,444 | 3,442 | 0 | 0 |
| 2023 | 0 | 0 | 0 | 0 |
| 2024 | 0 | 0 | 0 | 0 |
| 2025 | - | - | - | - |
| Total | 42,461 | 39,465 | 37,979 | 52,427 |
Year | Sales |
|---|---|
| 2022 | 5,886 |
| 2021 | 14,322 |
| 2020 | 25,348 |
| 2019 | 21,514 |
| 2018 | 24,136 |
| 2017 | 24,104 |
| 2016 | 24,545 |
| 2015 | 25,593 |
| 2014 | 6,884 |
| Total | 172,332 |
Download Historic Sales Data
Embedded Code
See more widgetsSources: Manufacturers