Key Stats
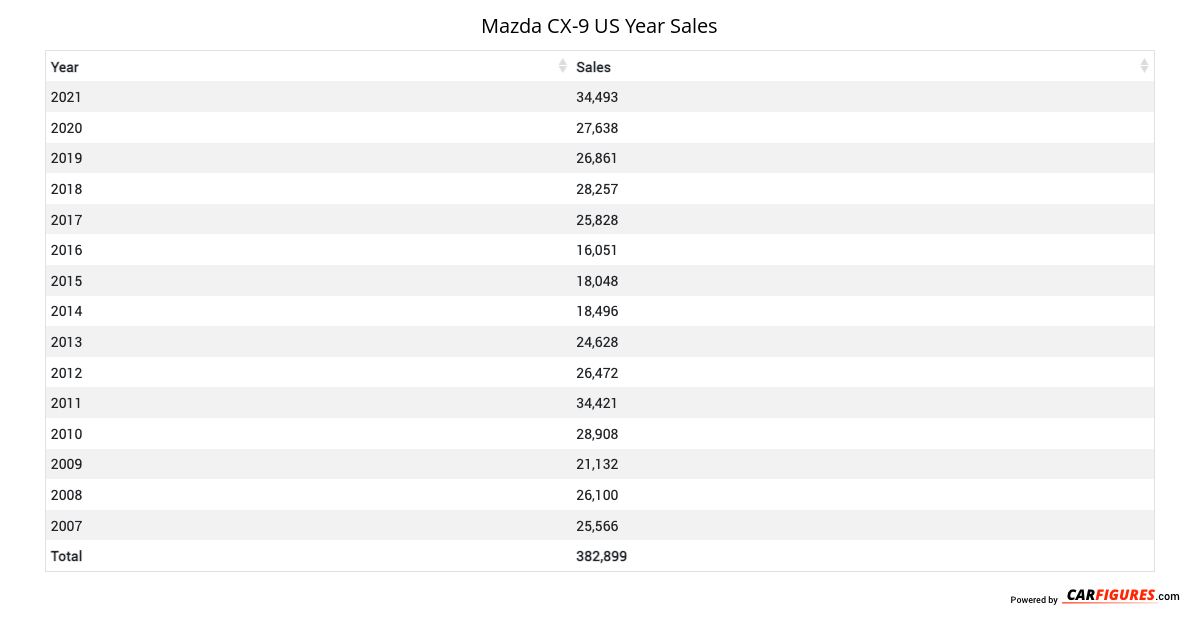
How many CX-9 did Mazda sell in 2024?
Mazda sold 4 CX-9 in 2024. In 2023, Mazda sold 17,451 CX-9. They sold 17,447 more units in year 2023 compared to 2024 with a percent loss of 99.98% YoY.
Overview
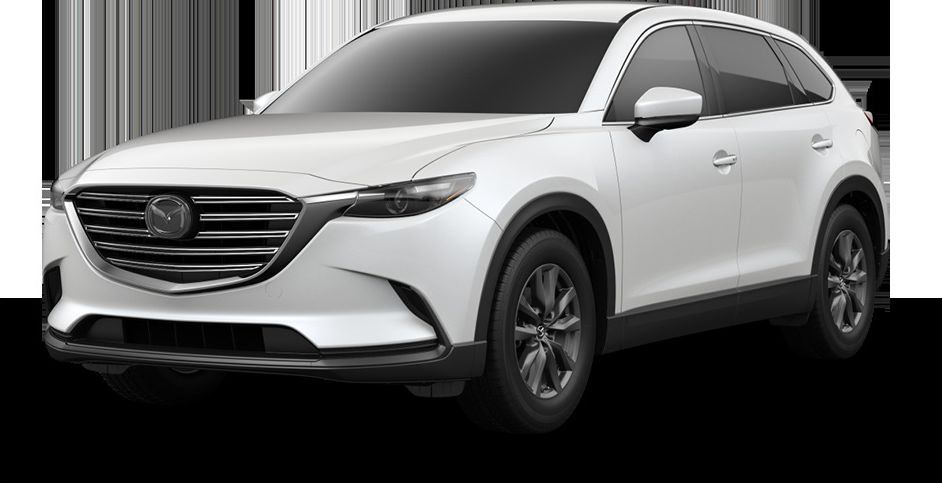
The 2022 Mazda CX-9 is a vehicle from automaker Mazda.
How Much Does the 2022 Mazda CX-9 Cost?
The 2022 Mazda CX-9 starts at $35,280 MSRP. Fully loaded, the Mazda CX-9 will cost you about $47,210.
Mazda CX-9 Engine, Transmission, and Performance Numbers
Mazda CX-9 includes a 2.5-liter engine combined with a SKYACTIV-Drive 6-Speed Automatic. This delivers 227 hp with 310 lb-ft torque delivered through a All Wheel Drive drivetrain.
List of Mazda CX-9 Competitors
Some of Mazda CX-9 competitors include the Ford Explorer, GMC Acadia and Toyota Highlander.
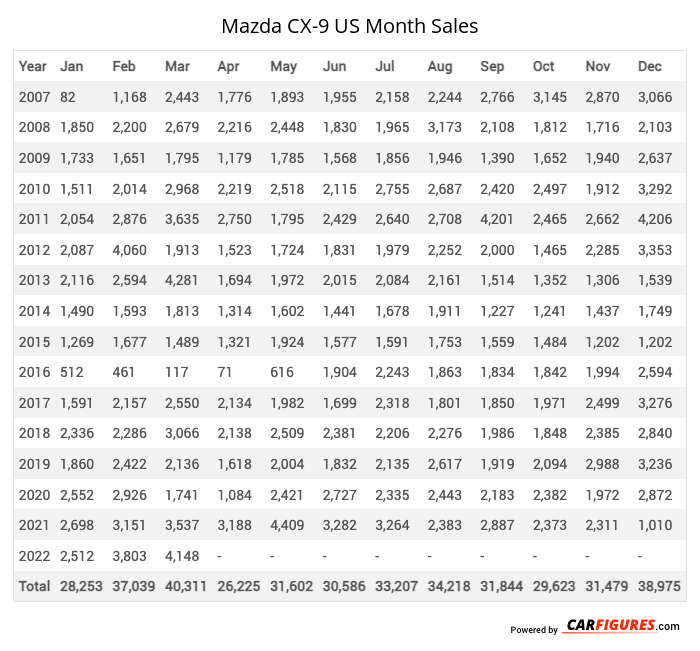
Mazda CX-9 United States Sale figures by year, quarter, and month are presented below. Including the most up to date sales data for the Mazda CX-9. See how the Mazda CX-9 stacks up the other models in the Crossover/SUVS, Midsize Crossover/SUVs segments.
Year | Jan | Feb | Mar | Apr | May | Jun | Jul | Aug | Sep | Oct | Nov | Dec |
|---|---|---|---|---|---|---|---|---|---|---|---|---|
| 2007 | 82 | 1,168 | 2,443 | 1,776 | 1,893 | 1,955 | 2,158 | 2,244 | 2,766 | 3,145 | 2,870 | 3,066 |
| 2008 | 1,850 | 2,200 | 2,679 | 2,216 | 2,448 | 1,830 | 1,965 | 3,173 | 2,108 | 1,812 | 1,716 | 2,103 |
| 2009 | 1,733 | 1,651 | 1,795 | 1,179 | 1,785 | 1,568 | 1,856 | 1,946 | 1,390 | 1,652 | 1,940 | 2,637 |
| 2010 | 1,511 | 2,014 | 2,968 | 2,219 | 2,518 | 2,115 | 2,755 | 2,687 | 2,420 | 2,497 | 1,912 | 3,292 |
| 2011 | 2,054 | 2,876 | 3,635 | 2,750 | 1,795 | 2,429 | 2,640 | 2,708 | 4,201 | 2,465 | 2,662 | 4,206 |
| 2012 | 2,087 | 4,060 | 1,913 | 1,523 | 1,724 | 1,831 | 1,979 | 2,252 | 2,000 | 1,465 | 2,285 | 3,353 |
| 2013 | 2,116 | 2,594 | 4,281 | 1,694 | 1,972 | 2,015 | 2,084 | 2,161 | 1,514 | 1,352 | 1,306 | 1,539 |
| 2014 | 1,490 | 1,593 | 1,813 | 1,314 | 1,602 | 1,441 | 1,678 | 1,911 | 1,227 | 1,241 | 1,437 | 1,749 |
| 2015 | 1,269 | 1,677 | 1,489 | 1,321 | 1,924 | 1,577 | 1,591 | 1,753 | 1,559 | 1,484 | 1,202 | 1,202 |
| 2016 | 512 | 461 | 117 | 71 | 616 | 1,904 | 2,243 | 1,863 | 1,834 | 1,842 | 1,994 | 2,594 |
| 2017 | 1,591 | 2,157 | 2,550 | 2,134 | 1,982 | 1,699 | 2,318 | 1,801 | 1,850 | 1,971 | 2,499 | 3,276 |
| 2018 | 2,336 | 2,286 | 3,066 | 2,138 | 2,509 | 2,381 | 2,206 | 2,276 | 1,986 | 1,848 | 2,385 | 2,840 |
| 2019 | 1,860 | 2,422 | 2,136 | 1,618 | 2,004 | 1,832 | 2,135 | 2,617 | 1,919 | 2,094 | 2,988 | 3,236 |
| 2020 | 2,552 | 2,926 | 1,741 | 1,084 | 2,421 | 2,727 | 2,335 | 2,443 | 2,183 | 2,382 | 1,972 | 2,872 |
| 2021 | 2,698 | 3,151 | 3,537 | 3,188 | 4,409 | 3,282 | 3,264 | 2,383 | 2,887 | 2,373 | 2,311 | 1,010 |
| 2022 | 2,512 | 3,803 | 4,148 | 3,107 | 1,453 | 1,157 | 1,919 | 2,106 | 3,264 | 3,391 | 4,025 | 3,695 |
| 2023 | 3,170 | 3,515 | 3,151 | 3,311 | 3,349 | 863 | 60 | 9 | 12 | 7 | 2 | 2 |
| 2024 | 0 | 1 | 2 | 0 | 1 | 0 | 0 | 0 | 0 | 0 | 0 | 0 |
| 2025 | - | - | - | - | - | - | - | - | - | - | - | - |
| Total | 31,423 | 40,555 | 43,464 | 32,643 | 36,405 | 32,606 | 35,186 | 36,333 | 35,120 | 33,021 | 35,506 | 42,672 |
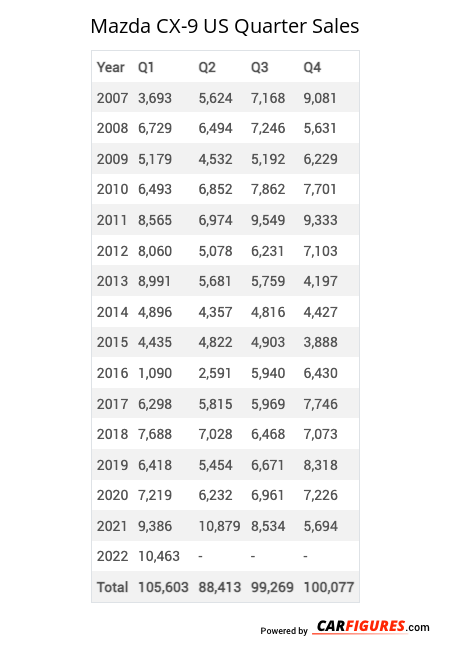
Year | Q1 | Q2 | Q3 | Q4 |
|---|---|---|---|---|
| 2007 | 3,693 | 5,624 | 7,168 | 9,081 |
| 2008 | 6,729 | 6,494 | 7,246 | 5,631 |
| 2009 | 5,179 | 4,532 | 5,192 | 6,229 |
| 2010 | 6,493 | 6,852 | 7,862 | 7,701 |
| 2011 | 8,565 | 6,974 | 9,549 | 9,333 |
| 2012 | 8,060 | 5,078 | 6,231 | 7,103 |
| 2013 | 8,991 | 5,681 | 5,759 | 4,197 |
| 2014 | 4,896 | 4,357 | 4,816 | 4,427 |
| 2015 | 4,435 | 4,822 | 4,903 | 3,888 |
| 2016 | 1,090 | 2,591 | 5,940 | 6,430 |
| 2017 | 6,298 | 5,815 | 5,969 | 7,746 |
| 2018 | 7,688 | 7,028 | 6,468 | 7,073 |
| 2019 | 6,418 | 5,454 | 6,671 | 8,318 |
| 2020 | 7,219 | 6,232 | 6,961 | 7,226 |
| 2021 | 9,386 | 10,879 | 8,534 | 5,694 |
| 2022 | 10,463 | 5,717 | 7,289 | 11,111 |
| 2023 | 9,836 | 7,523 | 81 | 11 |
| 2024 | 3 | 1 | 0 | 0 |
| 2025 | - | - | - | - |
| Total | 115,442 | 101,654 | 106,639 | 111,199 |
Year | Sales |
|---|---|
| 2024 | 4 |
| 2023 | 17,451 |
| 2022 | 34,580 |
| 2021 | 34,493 |
| 2020 | 27,638 |
| 2019 | 26,861 |
| 2018 | 28,257 |
| 2017 | 25,828 |
| 2016 | 16,051 |
| 2015 | 18,048 |
| 2014 | 18,496 |
| 2013 | 24,628 |
| 2012 | 26,472 |
| 2011 | 34,421 |
| 2010 | 28,908 |
| 2009 | 21,132 |
| 2008 | 26,100 |
| 2007 | 25,566 |
| Total | 434,934 |
Download Historic Sales Data
Embedded Code
See more widgetsSources: Manufacturers