Key Stats
How many Sportage did Kia sell in 2025?
Kia sold 41,301 Sportage in 2025. (From Jan - Mar 2025)
How many Sportage did Kia sell in March 2025?
Kia sold 16,872 Sportage in March 2025.
How many Sportage did Kia sell in 2024?
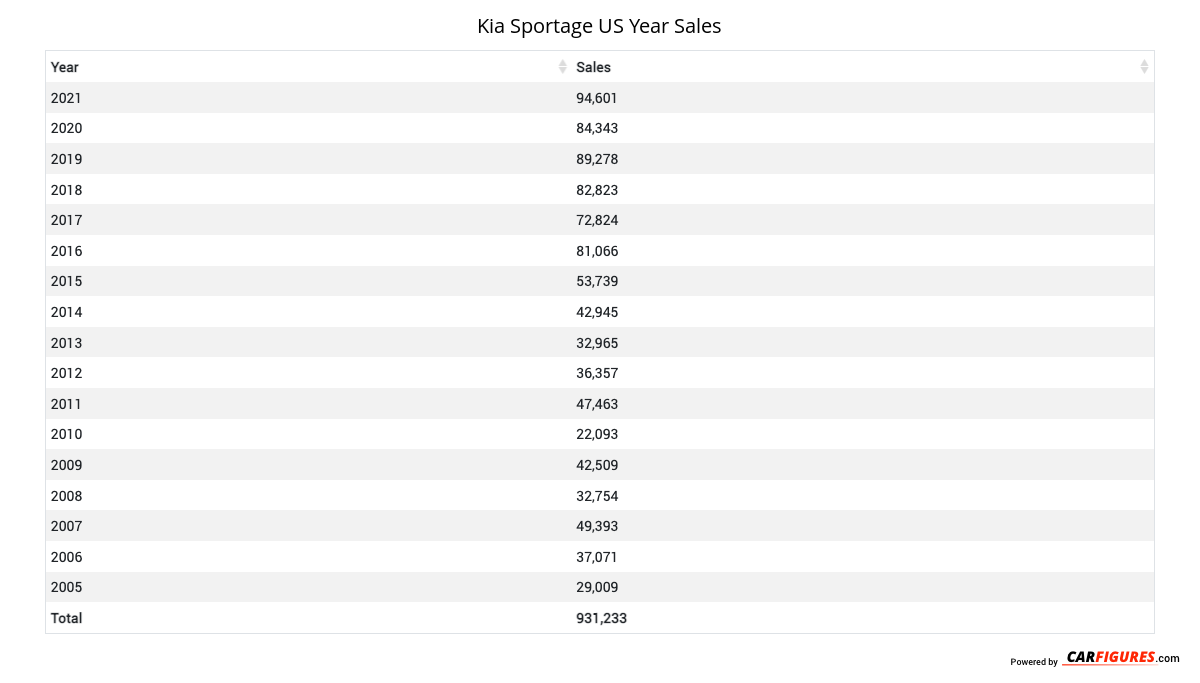
Kia sold 261,917 Sportage in 2024. In 2023, Kia sold 128,500 Sportage. They sold 133,417 more units in 2024 compared to 2023 with a percent gain of 103.83% YoY.
Overview
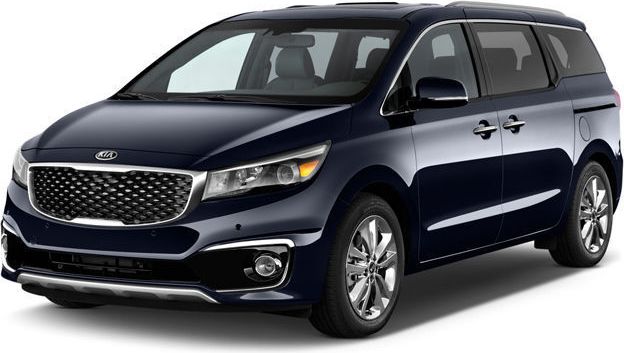
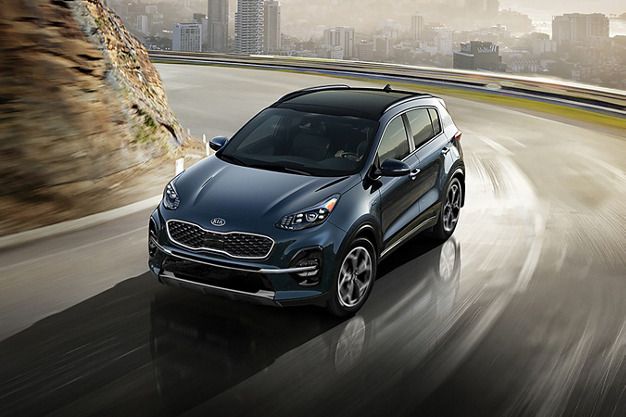
The 2024 Kia Sportage is a vehicle from automaker Kia.
How Much Does the 2024 Kia Sportage Cost?
The 2024 Kia Sportage starts at $27,090 MSRP. Fully loaded, the Kia Sportage will cost you about $37,890.
Kia Sportage Engine, Transmission, and Performance Numbers
Kia Sportage includes a 2.5-liter engine combined with an 8-Speed Automatic. This delivers 187 hp with 178 lb-ft torque delivered through a Front Wheel Drive drivetrain.
List of Kia Sportage Competitors
Some of Kia Sportage competitors include the Kia Sorento, Hyundai Tucson and Honda CR-V.
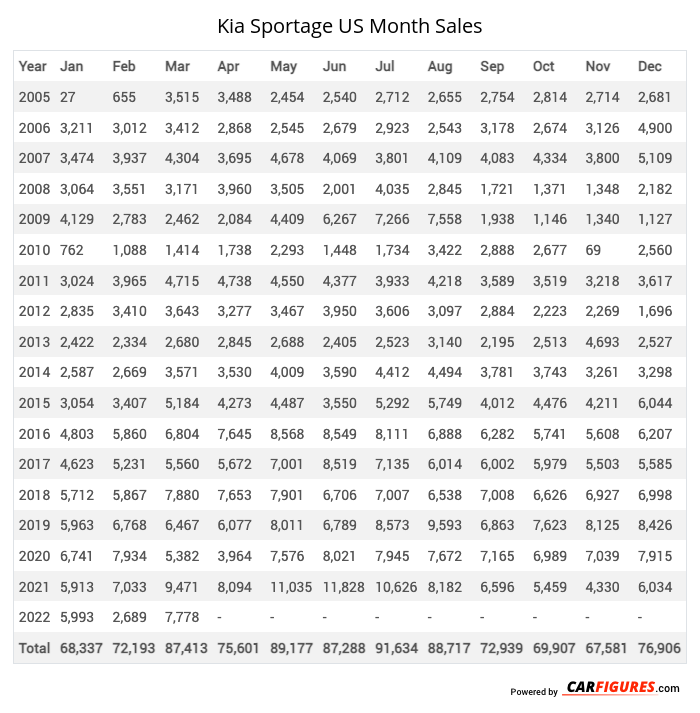
Kia Sportage United States Sale figures by year, quarter, and month are presented below. Including the most up to date sales data for the Kia Sportage. See how the Kia Sportage stacks up the other models in the Compact Crossover/SUVs, Crossover/SUVS segments.
Year | Jan | Feb | Mar | Apr | May | Jun | Jul | Aug | Sep | Oct | Nov | Dec |
|---|---|---|---|---|---|---|---|---|---|---|---|---|
| 2005 | 27 | 655 | 3,515 | 3,488 | 2,454 | 2,540 | 2,712 | 2,655 | 2,754 | 2,814 | 2,714 | 2,681 |
| 2006 | 3,211 | 3,012 | 3,412 | 2,868 | 2,545 | 2,679 | 2,923 | 2,543 | 3,178 | 2,674 | 3,126 | 4,900 |
| 2007 | 3,474 | 3,937 | 4,304 | 3,695 | 4,678 | 4,069 | 3,801 | 4,109 | 4,083 | 4,334 | 3,800 | 5,109 |
| 2008 | 3,064 | 3,551 | 3,171 | 3,960 | 3,505 | 2,001 | 4,035 | 2,845 | 1,721 | 1,371 | 1,348 | 2,182 |
| 2009 | 4,129 | 2,783 | 2,462 | 2,084 | 4,409 | 6,267 | 7,266 | 7,558 | 1,938 | 1,146 | 1,340 | 1,127 |
| 2010 | 762 | 1,088 | 1,414 | 1,738 | 2,293 | 1,448 | 1,734 | 3,422 | 2,888 | 2,677 | 69 | 2,560 |
| 2011 | 3,024 | 3,965 | 4,715 | 4,738 | 4,550 | 4,377 | 3,933 | 4,218 | 3,589 | 3,519 | 3,218 | 3,617 |
| 2012 | 2,835 | 3,410 | 3,643 | 3,277 | 3,467 | 3,950 | 3,606 | 3,097 | 2,884 | 2,223 | 2,269 | 1,696 |
| 2013 | 2,422 | 2,334 | 2,680 | 2,845 | 2,688 | 2,405 | 2,523 | 3,140 | 2,195 | 2,513 | 4,693 | 2,527 |
| 2014 | 2,587 | 2,669 | 3,571 | 3,530 | 4,009 | 3,590 | 4,412 | 4,494 | 3,781 | 3,743 | 3,261 | 3,298 |
| 2015 | 3,054 | 3,407 | 5,184 | 4,273 | 4,487 | 3,550 | 5,292 | 5,749 | 4,012 | 4,476 | 4,211 | 6,044 |
| 2016 | 4,803 | 5,860 | 6,804 | 7,645 | 8,568 | 8,549 | 8,111 | 6,888 | 6,282 | 5,741 | 5,608 | 6,207 |
| 2017 | 4,623 | 5,231 | 5,560 | 5,672 | 7,001 | 8,519 | 7,135 | 6,014 | 6,002 | 5,979 | 5,503 | 5,585 |
| 2018 | 5,712 | 5,867 | 7,880 | 7,653 | 7,901 | 6,706 | 7,007 | 6,538 | 7,008 | 6,626 | 6,927 | 6,998 |
| 2019 | 5,963 | 6,768 | 6,467 | 6,077 | 8,011 | 6,789 | 8,573 | 9,593 | 6,863 | 7,623 | 8,125 | 8,426 |
| 2020 | 6,741 | 7,934 | 5,382 | 3,964 | 7,576 | 8,021 | 7,945 | 7,672 | 7,165 | 6,989 | 7,039 | 7,915 |
| 2021 | 5,913 | 7,033 | 9,471 | 8,094 | 11,035 | 11,828 | 10,626 | 8,182 | 6,596 | 5,459 | 4,330 | 6,034 |
| 2022 | 5,993 | 2,689 | 7,778 | 11,380 | 10,363 | 14,153 | 11,985 | 11,985 | 12,412 | 11,877 | 10,554 | 13,075 |
| 2023 | 8,602 | 10,117 | 12,965 | 13,426 | 12,862 | 13,917 | 11,853 | 0 | 11,562 | 11,053 | 11,010 | 11,133 |
| 2024 | 9,994 | 12,081 | 15,211 | 13,739 | 15,512 | 13,316 | 12,628 | 15,114 | 111,163 | 13,681 | 14,051 | 15,427 |
| 2025 | 11,357 | 13,072 | 16,872 | - | - | - | - | - | - | - | - | - |
| Total | 98,290 | 107,463 | 132,461 | 114,146 | 127,914 | 128,674 | 128,100 | 115,816 | 208,076 | 106,518 | 103,196 | 116,541 |
Year | Q1 | Q2 | Q3 | Q4 |
|---|---|---|---|---|
| 2005 | 4,197 | 8,482 | 8,121 | 8,209 |
| 2006 | 9,635 | 8,092 | 8,644 | 10,700 |
| 2007 | 11,715 | 12,442 | 11,993 | 13,243 |
| 2008 | 9,786 | 9,466 | 8,601 | 4,901 |
| 2009 | 9,374 | 12,760 | 16,762 | 3,613 |
| 2010 | 3,264 | 5,479 | 8,044 | 5,306 |
| 2011 | 11,704 | 13,665 | 11,740 | 10,354 |
| 2012 | 9,888 | 10,694 | 9,587 | 6,188 |
| 2013 | 7,436 | 7,938 | 7,858 | 9,733 |
| 2014 | 8,827 | 11,129 | 12,687 | 10,302 |
| 2015 | 11,645 | 12,310 | 15,053 | 14,731 |
| 2016 | 17,467 | 24,762 | 21,281 | 17,556 |
| 2017 | 15,414 | 21,192 | 19,151 | 17,067 |
| 2018 | 19,459 | 22,260 | 20,553 | 20,551 |
| 2019 | 19,198 | 20,877 | 25,029 | 24,174 |
| 2020 | 20,057 | 19,561 | 22,782 | 21,943 |
| 2021 | 22,417 | 30,957 | 25,404 | 15,823 |
| 2022 | 16,460 | 35,896 | 36,382 | 35,506 |
| 2023 | 31,684 | 40,205 | 23,415 | 33,196 |
| 2024 | 37,286 | 42,567 | 138,905 | 43,159 |
| 2025 | 41,301 | - | - | - |
| Total | 338,214 | 370,734 | 451,992 | 326,255 |
Year | Sales |
|---|---|
| 2024 | 261,917 |
| 2023 | 128,500 |
| 2022 | 124,244 |
| 2021 | 94,601 |
| 2020 | 84,343 |
| 2019 | 89,278 |
| 2018 | 82,823 |
| 2017 | 72,824 |
| 2016 | 81,066 |
| 2015 | 53,739 |
| 2014 | 42,945 |
| 2013 | 32,965 |
| 2012 | 36,357 |
| 2011 | 47,463 |
| 2010 | 22,093 |
| 2009 | 42,509 |
| 2008 | 32,754 |
| 2007 | 49,393 |
| 2006 | 37,071 |
| 2005 | 29,009 |
| Total | 1,445,894 |
Download Historic Sales Data

Embedded Code
See more widgetsSources: Manufacturers