Key Stats
How many Terrain did GMC sell in 2024?
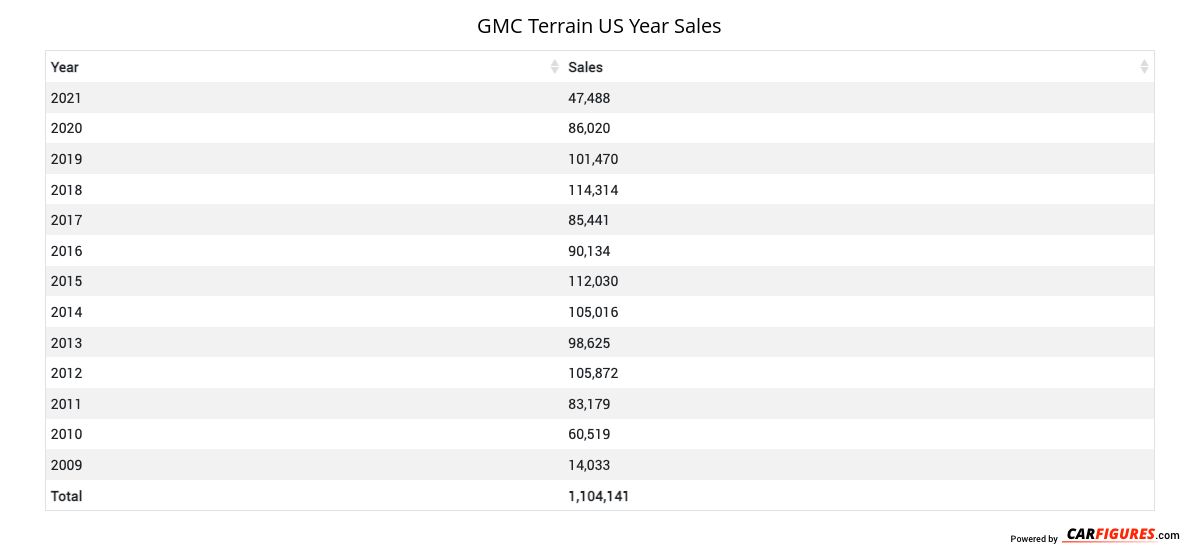
GMC sold 82,099 Terrain in 2024. In 2023, GMC sold 54,852 Terrain. They sold 27,247 more units in 2024 compared to 2023 with a percent gain of 49.67% YoY.
Overview
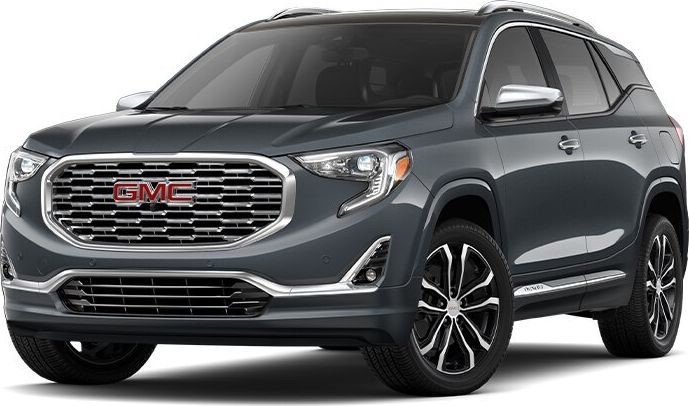
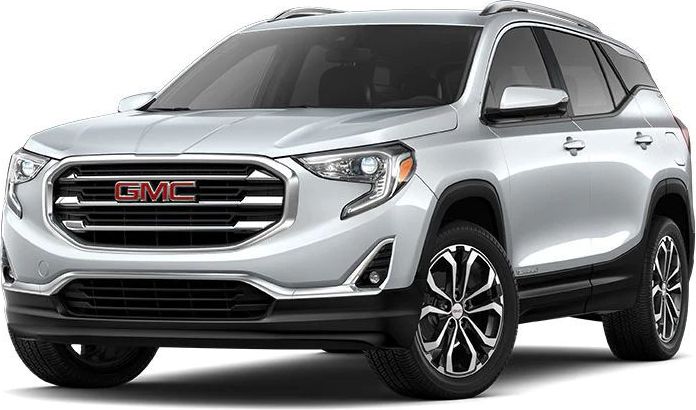
The 2024 GMC Terrain is a vehicle from automaker GMC.
How Much Does the 2024 GMC Terrain Cost?
Pricing for the 2024 GMC Terrain starts at $28,700 MSRP and goes up to $38,600 fully loaded.
GMC Terrain Engine, Transmission, and Performance Numbers
GMC Terrain is powered by a 1.5-liter engine with a Front Wheel Drive powertrain that makes 175 -hp and 203 lb-ft torque. The transmission on the GMC Terrain is an.
List of GMC Terrain Competitors
Some of GMC Terrain competitors include the Honda CR-V, Mazda CX-5 and Hyundai Tucson.
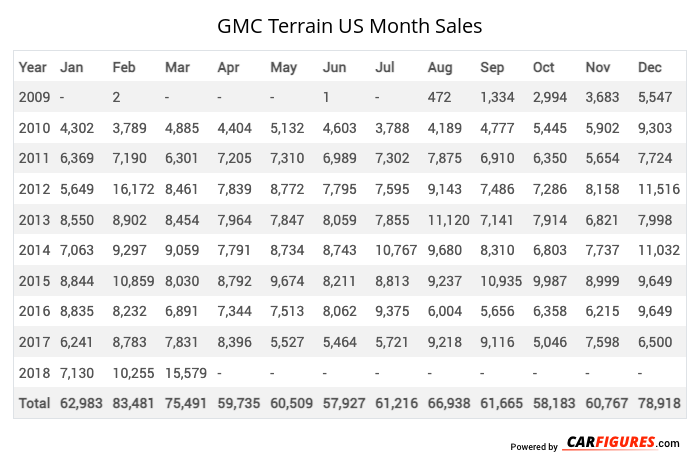
GMC Terrain United States Sale figures by year, quarter, and month are presented below. Including the most up to date sales data for the GMC Terrain. See how the GMC Terrain stacks up the other models in the Compact Crossover/SUVs, Crossover/SUVS segments.
Year | Jan | Feb | Mar | Apr | May | Jun | Jul | Aug | Sep | Oct | Nov | Dec |
|---|---|---|---|---|---|---|---|---|---|---|---|---|
| 2009 | - | 2 | - | - | - | 1 | - | 472 | 1,334 | 2,994 | 3,683 | 5,547 |
| 2010 | 4,302 | 3,789 | 4,885 | 4,404 | 5,132 | 4,603 | 3,788 | 4,189 | 4,777 | 5,445 | 5,902 | 9,303 |
| 2011 | 6,369 | 7,190 | 6,301 | 7,205 | 7,310 | 6,989 | 7,302 | 7,875 | 6,910 | 6,350 | 5,654 | 7,724 |
| 2012 | 5,649 | 16,172 | 8,461 | 7,839 | 8,772 | 7,795 | 7,595 | 9,143 | 7,486 | 7,286 | 8,158 | 11,516 |
| 2013 | 8,550 | 8,902 | 8,454 | 7,964 | 7,847 | 8,059 | 7,855 | 11,120 | 7,141 | 7,914 | 6,821 | 7,998 |
| 2014 | 7,063 | 9,297 | 9,059 | 7,791 | 8,734 | 8,743 | 10,767 | 9,680 | 8,310 | 6,803 | 7,737 | 11,032 |
| 2015 | 8,844 | 10,859 | 8,030 | 8,792 | 9,674 | 8,211 | 8,813 | 9,237 | 10,935 | 9,987 | 8,999 | 9,649 |
| 2016 | 8,835 | 8,232 | 6,891 | 7,344 | 7,513 | 8,062 | 9,375 | 6,004 | 5,656 | 6,358 | 6,215 | 9,649 |
| 2017 | 6,241 | 8,783 | 7,831 | 8,396 | 5,527 | 5,464 | 5,721 | 9,218 | 9,116 | 5,046 | 7,598 | 6,500 |
| 2018 | 7,130 | 10,255 | 15,579 | - | - | - | - | - | - | - | - | - |
| Total | 62,983 | 83,481 | 75,491 | 59,735 | 60,509 | 57,927 | 61,216 | 66,938 | 61,665 | 58,183 | 60,767 | 78,918 |
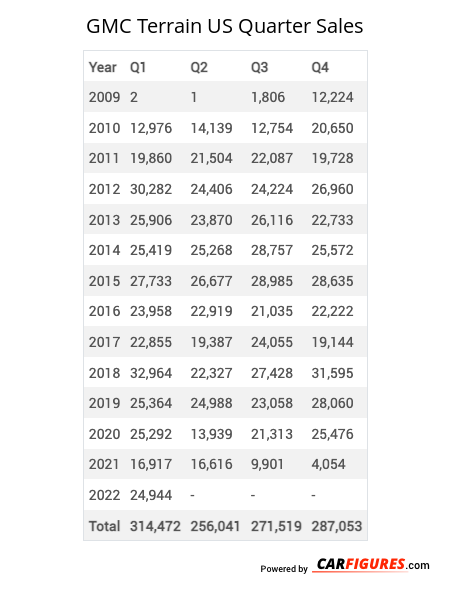
Year | Q1 | Q2 | Q3 | Q4 |
|---|---|---|---|---|
| 2009 | 2 | 1 | 1,806 | 12,224 |
| 2010 | 12,976 | 14,139 | 12,754 | 20,650 |
| 2011 | 19,860 | 21,504 | 22,087 | 19,728 |
| 2012 | 30,282 | 24,406 | 24,224 | 26,960 |
| 2013 | 25,906 | 23,870 | 26,116 | 22,733 |
| 2014 | 25,419 | 25,268 | 28,757 | 25,572 |
| 2015 | 27,733 | 26,677 | 28,985 | 28,635 |
| 2016 | 23,958 | 22,919 | 21,035 | 22,222 |
| 2017 | 22,855 | 19,387 | 24,055 | 19,144 |
| 2018 | 32,964 | 22,327 | 27,428 | 31,595 |
| 2019 | 25,364 | 24,988 | 23,058 | 28,060 |
| 2020 | 25,292 | 13,939 | 21,313 | 25,476 |
| 2021 | 16,917 | 16,616 | 9,901 | 4,054 |
| 2022 | 24,944 | 22,758 | 17,918 | 20,948 |
| 2023 | 17,927 | 19,697 | 0 | 17,228 |
| 2024 | 21,864 | 27,258 | 16,164 | 16,813 |
| 2025 | - | - | - | - |
| Total | 354,263 | 325,754 | 305,601 | 342,042 |
Year | Sales |
|---|---|
| 2024 | 82,099 |
| 2023 | 54,852 |
| 2022 | 86,568 |
| 2021 | 47,488 |
| 2020 | 86,020 |
| 2019 | 101,470 |
| 2018 | 114,314 |
| 2017 | 85,441 |
| 2016 | 90,134 |
| 2015 | 112,030 |
| 2014 | 105,016 |
| 2013 | 98,625 |
| 2012 | 105,872 |
| 2011 | 83,179 |
| 2010 | 60,519 |
| 2009 | 14,033 |
| Total | 1,327,660 |
Download Historic Sales Data
Embedded Code
See more widgetsSources: Manufacturers