
Key Stats
How many Sierra did GMC sell in 2024?
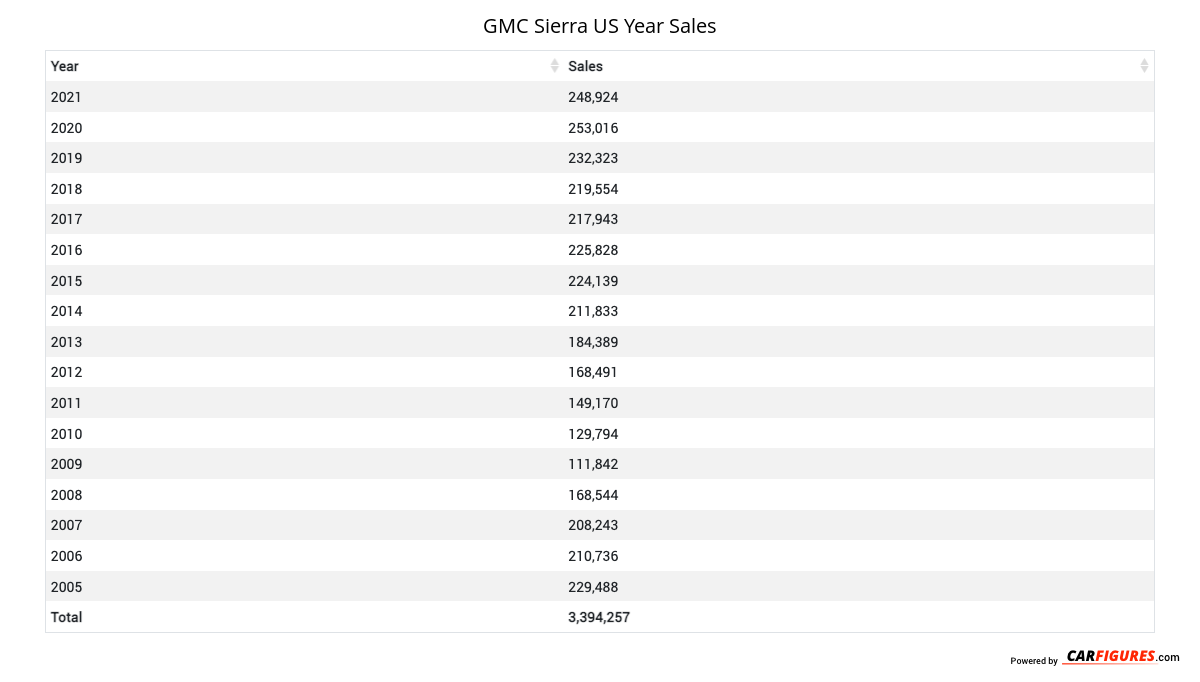
GMC sold 298,698 Sierra in 2024. In 2023, GMC sold 222,519 Sierra. They sold 76,179 more units in 2024 compared to 2023 with a percent gain of 34.23% YoY.
Overview
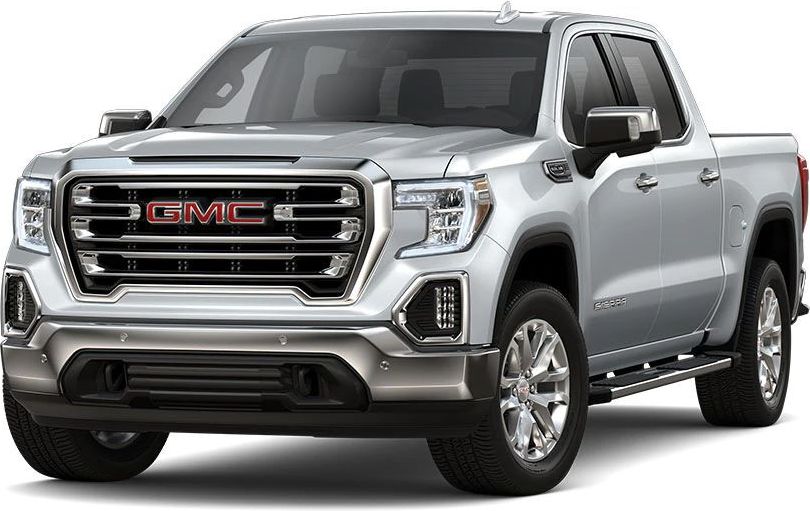
The GMC Sierra 1500 is a Regular Cab Pickup with room for 3 people from automaker GMC.
How Much Does the 2020 GMC Sierra 1500 Cost?
Pricing for the 2020 GMC Sierra 1500 starts at $29,600 MSRP and goes up to $58,900 fully loaded.
GMC Sierra 1500 Engine, Transmission, and Performance Numbers
GMC Sierra 1500 includes a 4.3-liter V-6 engine combined with a. This delivers 285 hp with torque delivered through a RWD drivetrain.
2020 GMC Sierra 1500 Fuel Economy
The 2020 GMC Sierra 1500 is expected to get 18 mpg combined.
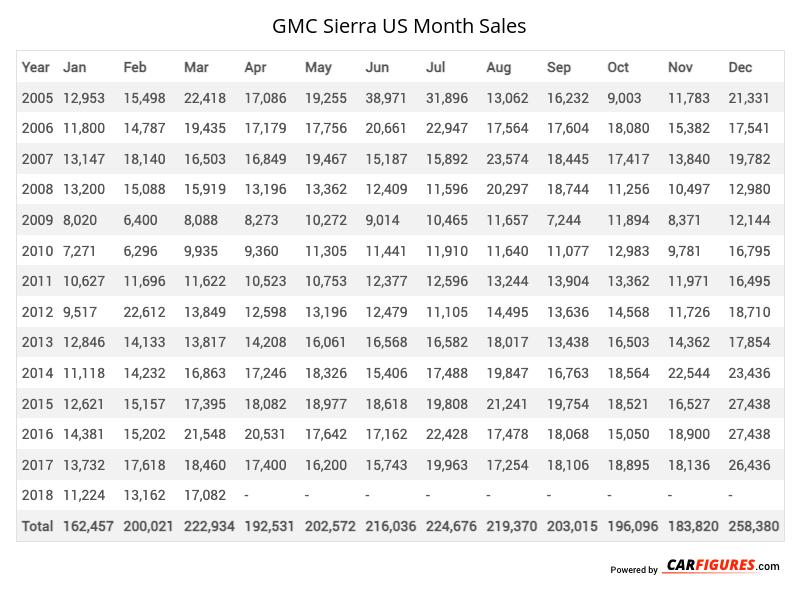
GMC Sierra United States Sale figures by year, quarter, and month are presented below. Including the most up to date sales data for the GMC Sierra. See how the GMC Sierra stacks up the other models in the Large Pickup Trucks, Pickup Trucks segments.
*Sales report includes HD, LD
Year | Jan | Feb | Mar | Apr | May | Jun | Jul | Aug | Sep | Oct | Nov | Dec |
|---|---|---|---|---|---|---|---|---|---|---|---|---|
| 2005 | 12,953 | 15,498 | 22,418 | 17,086 | 19,255 | 38,971 | 31,896 | 13,062 | 16,232 | 9,003 | 11,783 | 21,331 |
| 2006 | 11,800 | 14,787 | 19,435 | 17,179 | 17,756 | 20,661 | 22,947 | 17,564 | 17,604 | 18,080 | 15,382 | 17,541 |
| 2007 | 13,147 | 18,140 | 16,503 | 16,849 | 19,467 | 15,187 | 15,892 | 23,574 | 18,445 | 17,417 | 13,840 | 19,782 |
| 2008 | 13,200 | 15,088 | 15,919 | 13,196 | 13,362 | 12,409 | 11,596 | 20,297 | 18,744 | 11,256 | 10,497 | 12,980 |
| 2009 | 8,020 | 6,400 | 8,088 | 8,273 | 10,272 | 9,014 | 10,465 | 11,657 | 7,244 | 11,894 | 8,371 | 12,144 |
| 2010 | 7,271 | 6,296 | 9,935 | 9,360 | 11,305 | 11,441 | 11,910 | 11,640 | 11,077 | 12,983 | 9,781 | 16,795 |
| 2011 | 10,627 | 11,696 | 11,622 | 10,523 | 10,753 | 12,377 | 12,596 | 13,244 | 13,904 | 13,362 | 11,971 | 16,495 |
| 2012 | 9,517 | 22,612 | 13,849 | 12,598 | 13,196 | 12,479 | 11,105 | 14,495 | 13,636 | 14,568 | 11,726 | 18,710 |
| 2013 | 12,846 | 14,133 | 13,817 | 14,208 | 16,061 | 16,568 | 16,582 | 18,017 | 13,438 | 16,503 | 14,362 | 17,854 |
| 2014 | 11,118 | 14,232 | 16,863 | 17,246 | 18,326 | 15,406 | 17,488 | 19,847 | 16,763 | 18,564 | 22,544 | 23,436 |
| 2015 | 12,621 | 15,157 | 17,395 | 18,082 | 18,977 | 18,618 | 19,808 | 21,241 | 19,754 | 18,521 | 16,527 | 27,438 |
| 2016 | 14,381 | 15,202 | 21,548 | 20,531 | 17,642 | 17,162 | 22,428 | 17,478 | 18,068 | 15,050 | 18,900 | 27,438 |
| 2017 | 13,732 | 17,618 | 18,460 | 17,400 | 16,200 | 15,743 | 19,963 | 17,254 | 18,106 | 18,895 | 18,136 | 26,436 |
| 2018 | 11,224 | 13,162 | 17,082 | - | - | - | - | - | - | - | - | - |
| Total | 162,457 | 200,021 | 222,934 | 192,531 | 202,572 | 216,036 | 224,676 | 219,370 | 203,015 | 196,096 | 183,820 | 258,380 |
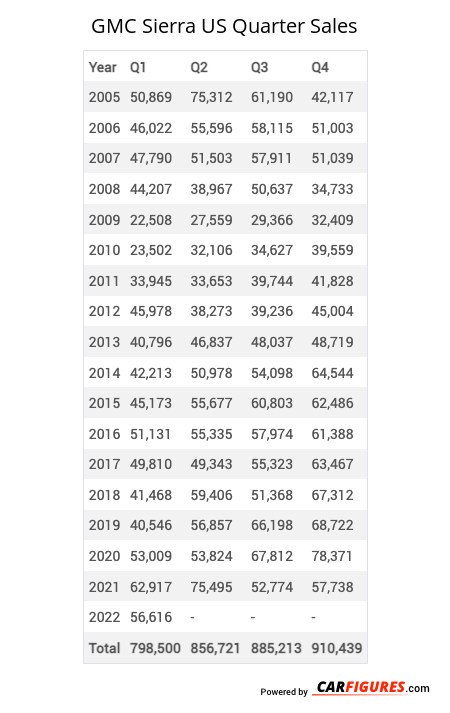
Year | Q1 | Q2 | Q3 | Q4 |
|---|---|---|---|---|
| 2005 | 50,869 | 75,312 | 61,190 | 42,117 |
| 2006 | 46,022 | 55,596 | 58,115 | 51,003 |
| 2007 | 47,790 | 51,503 | 57,911 | 51,039 |
| 2008 | 44,207 | 38,967 | 50,637 | 34,733 |
| 2009 | 22,508 | 27,559 | 29,366 | 32,409 |
| 2010 | 23,502 | 32,106 | 34,627 | 39,559 |
| 2011 | 33,945 | 33,653 | 39,744 | 41,828 |
| 2012 | 45,978 | 38,273 | 39,236 | 45,004 |
| 2013 | 40,796 | 46,837 | 48,037 | 48,719 |
| 2014 | 42,213 | 50,978 | 54,098 | 64,544 |
| 2015 | 45,173 | 55,677 | 60,803 | 62,486 |
| 2016 | 51,131 | 55,335 | 57,974 | 61,388 |
| 2017 | 49,810 | 49,343 | 55,323 | 63,467 |
| 2018 | 41,468 | 59,406 | 51,368 | 67,312 |
| 2019 | 40,546 | 56,857 | 66,198 | 68,722 |
| 2020 | 53,009 | 53,824 | 67,812 | 78,371 |
| 2021 | 62,917 | 75,495 | 52,774 | 57,738 |
| 2022 | 56,616 | 62,322 | 50,168 | 72,415 |
| 2023 | 67,198 | 75,810 | 0 | 79,511 |
| 2024 | 68,597 | 54,152 | 80,613 | 95,336 |
| 2025 | - | - | - | - |
| Total | 934,295 | 1,049,005 | 1,015,994 | 1,157,701 |
Year | Sales |
|---|---|
| 2024 | 298,698 |
| 2023 | 222,519 |
| 2022 | 241,521 |
| 2021 | 248,924 |
| 2020 | 253,016 |
| 2019 | 232,323 |
| 2018 | 219,554 |
| 2017 | 217,943 |
| 2016 | 225,828 |
| 2015 | 224,139 |
| 2014 | 211,833 |
| 2013 | 184,389 |
| 2012 | 168,491 |
| 2011 | 149,170 |
| 2010 | 129,794 |
| 2009 | 111,842 |
| 2008 | 168,544 |
| 2007 | 208,243 |
| 2006 | 210,736 |
| 2005 | 229,488 |
| Total | 4,156,995 |
Download Historic Sales Data
Embedded Code
See more widgetsSources: Manufacturers