
Key Stats
How many 2-Series did BMW sell in 2024?
BMW sold 3,936 2-Series in 2024. In 2023, BMW sold 8,484 2-Series. They sold 4,548 more units in year 2023 compared to 2024 with a percent loss of 53.61% YoY.
Overview
The 2024 BMW 230 is a vehicle from automaker BMW.
How Much Does the 2024 BMW 230 Cost?
Pricing for the 2024 BMW 230 starts at $38,800 MSRP and goes up to $40,800 fully loaded.
BMW 230 Engine, Transmission, and Performance Numbers
BMW 230 is powered by a 2.0-liter engine with a Rear Wheel Drive powertrain that makes 255 -hp and 295 lb-ft torque. The transmission on the BMW 230 is an 8-Speed Sport Automatic.
List of BMW 230 Competitors
Some of BMW 230 competitors include the Mercedes-Benz A-Class.
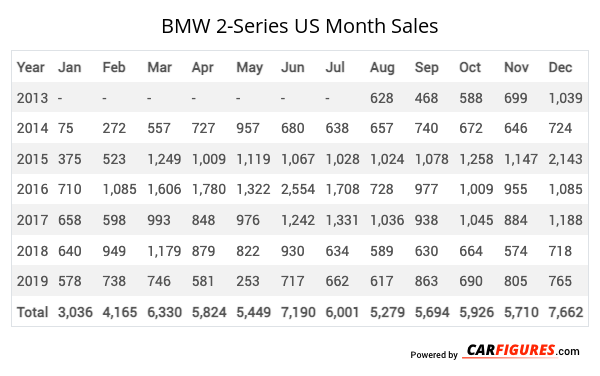
BMW 2-Series United States Sale figures by year, quarter, and month are presented below. Including the most up to date sales data for the BMW 2-Series. See how the BMW 2-Series stacks up the other models in the Cars, Premium Sport/Performance Cars segments.
*Sales report includes 2-Series, 1-Series
Year | Jan | Feb | Mar | Apr | May | Jun | Jul | Aug | Sep | Oct | Nov | Dec |
|---|---|---|---|---|---|---|---|---|---|---|---|---|
| 2013 | - | - | - | - | - | - | - | 628 | 468 | 588 | 699 | 1,039 |
| 2014 | 75 | 272 | 557 | 727 | 957 | 680 | 638 | 657 | 740 | 672 | 646 | 724 |
| 2015 | 375 | 523 | 1,249 | 1,009 | 1,119 | 1,067 | 1,028 | 1,024 | 1,078 | 1,258 | 1,147 | 2,143 |
| 2016 | 710 | 1,085 | 1,606 | 1,780 | 1,322 | 2,554 | 1,708 | 728 | 977 | 1,009 | 955 | 1,085 |
| 2017 | 658 | 598 | 993 | 848 | 976 | 1,242 | 1,331 | 1,036 | 938 | 1,045 | 884 | 1,188 |
| 2018 | 640 | 949 | 1,179 | 879 | 822 | 930 | 634 | 589 | 630 | 664 | 574 | 718 |
| 2019 | 578 | 738 | 746 | 581 | 253 | 717 | 662 | 617 | 863 | 690 | 805 | 765 |
| Total | 3,036 | 4,165 | 6,330 | 5,824 | 5,449 | 7,190 | 6,001 | 5,279 | 5,694 | 5,926 | 5,710 | 7,662 |
Year | Q1 | Q2 | Q3 | Q4 |
|---|---|---|---|---|
| 2013 | - | - | 1,096 | 2,326 |
| 2014 | 904 | 2,364 | 2,035 | 2,042 |
| 2015 | 2,147 | 3,195 | 3,130 | 4,548 |
| 2016 | 3,401 | 5,656 | 3,413 | 3,049 |
| 2017 | 2,249 | 3,066 | 3,305 | 3,117 |
| 2018 | 2,768 | 2,631 | 1,853 | 1,956 |
| 2019 | 2,062 | 1,551 | 2,142 | 2,260 |
| 2020 | 1,772 | 3,804 | 4,190 | 4,850 |
| 2021 | 5,307 | 4,033 | 3,211 | 3,132 |
| 2022 | 4,025 | 3,582 | 1,574 | 2,370 |
| 2023 | 1,383 | 2,805 | 0 | 4,296 |
| 2024 | 0 | 0 | 3,936 | 0 |
| 2025 | - | - | - | - |
| Total | 26,018 | 32,687 | 29,885 | 33,946 |
Year | Sales |
|---|---|
| 2024 | 3,936 |
| 2023 | 8,484 |
| 2022 | 11,551 |
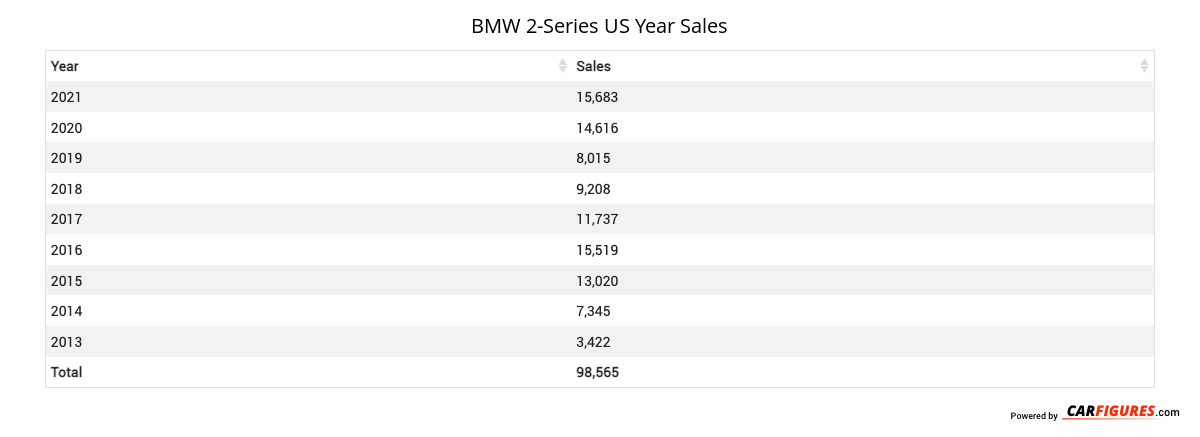
| 2021 | 15,683 |
| 2020 | 14,616 |
| 2019 | 8,015 |
| 2018 | 9,208 |
| 2017 | 11,737 |
| 2016 | 15,519 |
| 2015 | 13,020 |
| 2014 | 7,345 |
| 2013 | 3,422 |
| Total | 122,536 |
Download Historic Sales Data

Embedded Code
See more widgetsSources: Manufacturers