Key Stats
How many F-Series did Ford sell in Q4 2019?
Ford sold 17,196 F-Series in Q4 2019.
How many F-Series did Ford sell in 2021?
Ford sold 116,401 F-Series in 2021. In 2020, Ford sold 128,649 F-Series. They sold 12,248 more units in year 2020 compared to 2021 with a percent loss of 9.52% YoY.
Overview
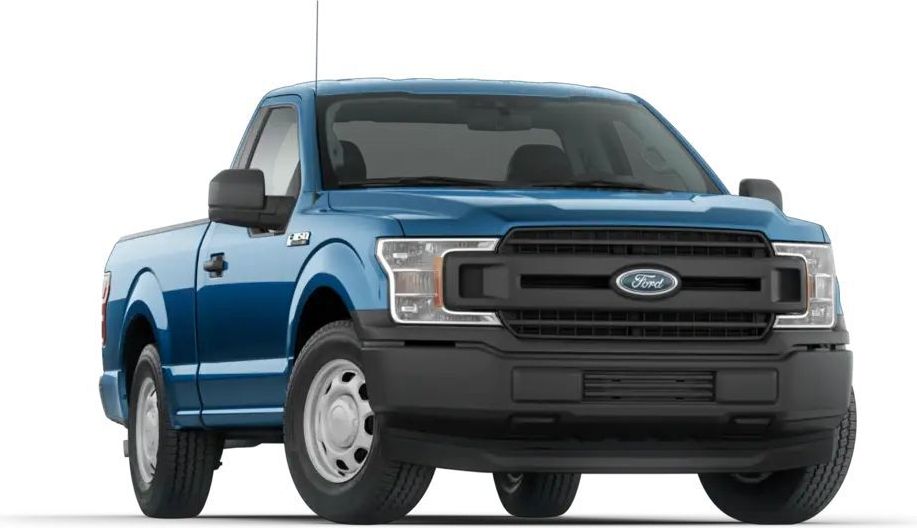
The 2022 Ford F-150 is a vehicle from automaker Ford.
How Much Does the 2022 Ford F-150 Cost?
The 2022 Ford F-150 starts at $34,395 MSRP. Fully loaded, the Ford F-150 will cost you about $92,590.
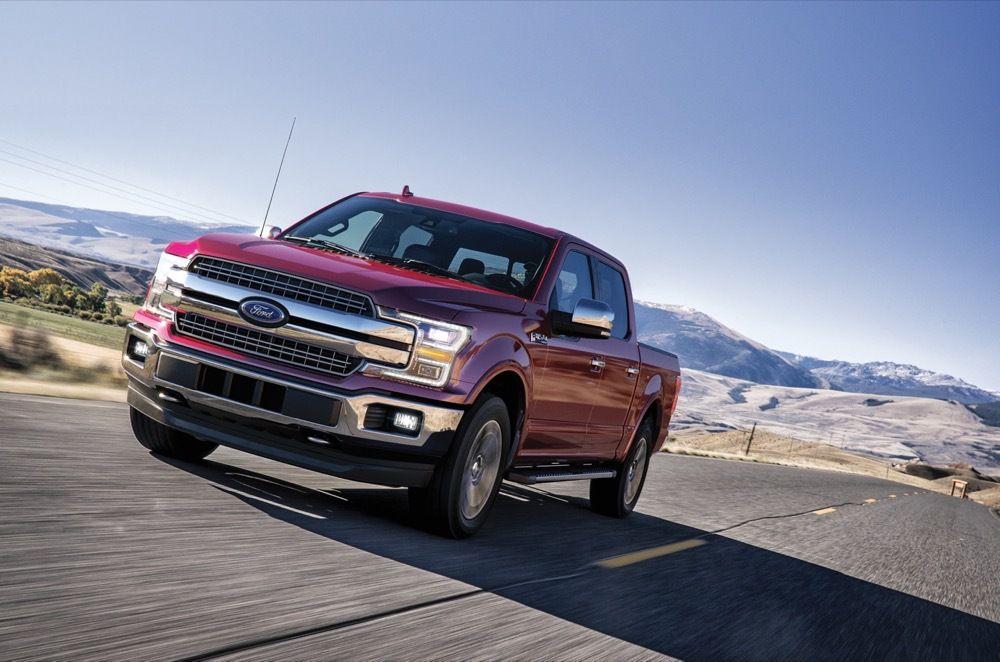
Ford F-150 Engine, Transmission, and Performance Numbers
Ford F-150 delivers 290 horsepower with 265 ft-lb torque delivered through a rear-wheel-drive drivetrain.
List of Ford F-150 Competitors
Some of Ford F-150 competitors include the Toyota Tundra.
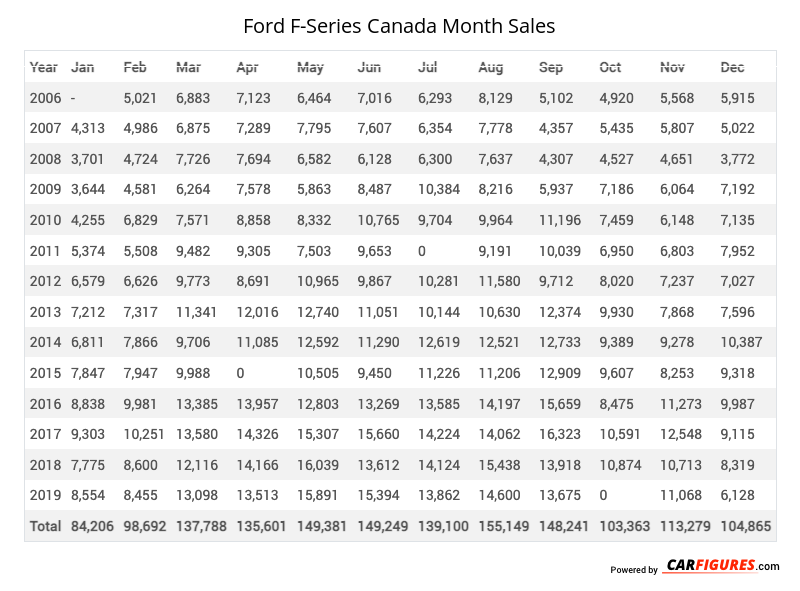
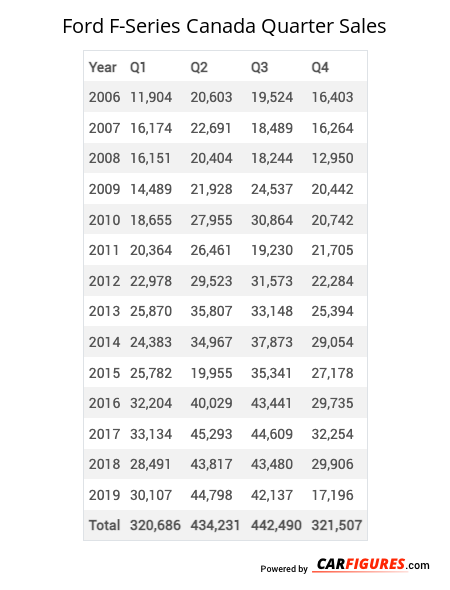
Ford F-Series Canadian Sale figures by year, quarter, and month are presented below. Including the most up to date sales data for the Ford F-Series. See how the Ford F-Series stacks up the other models in the Large Pickup Trucks, Pickup Trucks segments.
Year | Jan | Feb | Mar | Apr | May | Jun | Jul | Aug | Sep | Oct | Nov | Dec |
|---|---|---|---|---|---|---|---|---|---|---|---|---|
| 2006 | - | 5,021 | 6,883 | 7,123 | 6,464 | 7,016 | 6,293 | 8,129 | 5,102 | 4,920 | 5,568 | 5,915 |
| 2007 | 4,313 | 4,986 | 6,875 | 7,289 | 7,795 | 7,607 | 6,354 | 7,778 | 4,357 | 5,435 | 5,807 | 5,022 |
| 2008 | 3,701 | 4,724 | 7,726 | 7,694 | 6,582 | 6,128 | 6,300 | 7,637 | 4,307 | 4,527 | 4,651 | 3,772 |
| 2009 | 3,644 | 4,581 | 6,264 | 7,578 | 5,863 | 8,487 | 10,384 | 8,216 | 5,937 | 7,186 | 6,064 | 7,192 |
| 2010 | 4,255 | 6,829 | 7,571 | 8,858 | 8,332 | 10,765 | 9,704 | 9,964 | 11,196 | 7,459 | 6,148 | 7,135 |
| 2011 | 5,374 | 5,508 | 9,482 | 9,305 | 7,503 | 9,653 | 0 | 9,191 | 10,039 | 6,950 | 6,803 | 7,952 |
| 2012 | 6,579 | 6,626 | 9,773 | 8,691 | 10,965 | 9,867 | 10,281 | 11,580 | 9,712 | 8,020 | 7,237 | 7,027 |
| 2013 | 7,212 | 7,317 | 11,341 | 12,016 | 12,740 | 11,051 | 10,144 | 10,630 | 12,374 | 9,930 | 7,868 | 7,596 |
| 2014 | 6,811 | 7,866 | 9,706 | 11,085 | 12,592 | 11,290 | 12,619 | 12,521 | 12,733 | 9,389 | 9,278 | 10,387 |
| 2015 | 7,847 | 7,947 | 9,988 | 0 | 10,505 | 9,450 | 11,226 | 11,206 | 12,909 | 9,607 | 8,253 | 9,318 |
| 2016 | 8,838 | 9,981 | 13,385 | 13,957 | 12,803 | 13,269 | 13,585 | 14,197 | 15,659 | 8,475 | 11,273 | 9,987 |
| 2017 | 9,303 | 10,251 | 13,580 | 14,326 | 15,307 | 15,660 | 14,224 | 14,062 | 16,323 | 10,591 | 12,548 | 9,115 |
| 2018 | 7,775 | 8,600 | 12,116 | 14,166 | 16,039 | 13,612 | 14,124 | 15,438 | 13,918 | 10,874 | 10,713 | 8,319 |
| 2019 | 8,554 | 8,455 | 13,098 | 13,513 | 15,891 | 15,394 | 13,862 | 14,600 | 13,675 | 0 | 11,068 | 6,128 |
| Total | 84,206 | 98,692 | 137,788 | 135,601 | 149,381 | 149,249 | 139,100 | 155,149 | 148,241 | 103,363 | 113,279 | 104,865 |
Year | Q1 | Q2 | Q3 | Q4 |
|---|---|---|---|---|
| 2006 | 11,904 | 20,603 | 19,524 | 16,403 |
| 2007 | 16,174 | 22,691 | 18,489 | 16,264 |
| 2008 | 16,151 | 20,404 | 18,244 | 12,950 |
| 2009 | 14,489 | 21,928 | 24,537 | 20,442 |
| 2010 | 18,655 | 27,955 | 30,864 | 20,742 |
| 2011 | 20,364 | 26,461 | 19,230 | 21,705 |
| 2012 | 22,978 | 29,523 | 31,573 | 22,284 |
| 2013 | 25,870 | 35,807 | 33,148 | 25,394 |
| 2014 | 24,383 | 34,967 | 37,873 | 29,054 |
| 2015 | 25,782 | 19,955 | 35,341 | 27,178 |
| 2016 | 32,204 | 40,029 | 43,441 | 29,735 |
| 2017 | 33,134 | 45,293 | 44,609 | 32,254 |
| 2018 | 28,491 | 43,817 | 43,480 | 29,906 |
| 2019 | 30,107 | 44,798 | 42,137 | 17,196 |
| Total | 320,686 | 434,231 | 442,490 | 321,507 |
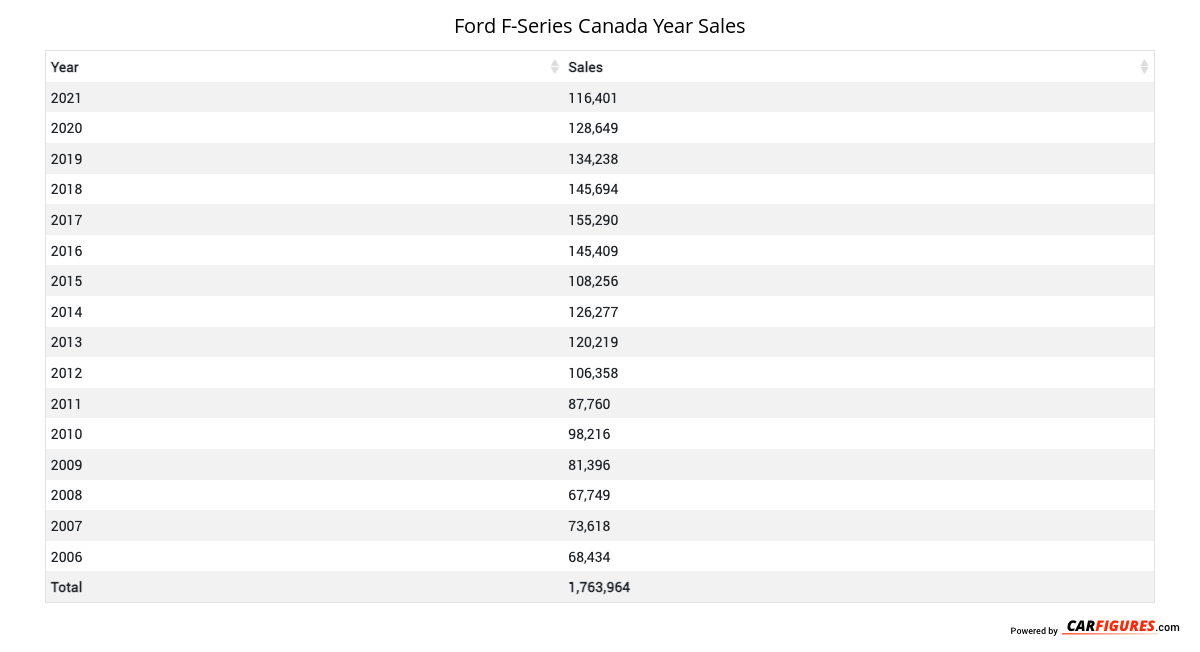
Year | Sales |
|---|---|
| 2021 | 116,401 |
| 2020 | 128,649 |
| 2019 | 134,238 |
| 2018 | 145,694 |
| 2017 | 155,290 |
| 2016 | 145,409 |
| 2015 | 108,256 |
| 2014 | 126,277 |
| 2013 | 120,219 |
| 2012 | 106,358 |
| 2011 | 87,760 |
| 2010 | 98,216 |
| 2009 | 81,396 |
| 2008 | 67,749 |
| 2007 | 73,618 |
| 2006 | 68,434 |
| Total | 1,763,964 |
Download Historic Sales Data
Embedded Code
See more widgetsSources: Manufacturers