Key Stats
How many Suburban did Chevrolet sell in 2024?
Chevrolet sold 44,400 Suburban in 2024. In 2023, Chevrolet sold 40,738 Suburban. They sold 3,662 more units in 2024 compared to 2023 with a percent gain of 8.99% YoY.
Overview
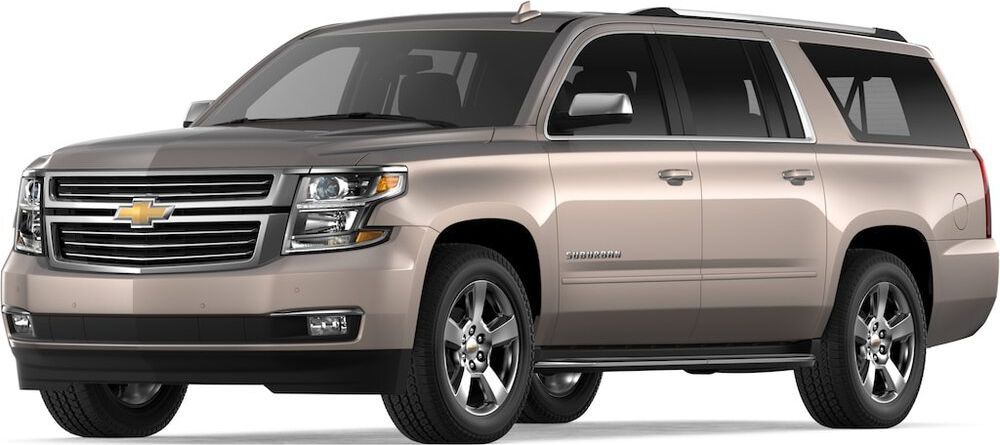
The 2022 Chevrolet Suburban is a vehicle from automaker Chevrolet.
How Much Does the 2022 Chevrolet Suburban Cost?
Pricing for the 2022 Chevrolet Suburban starts at $52,900 MSRP and goes up to $76,200 fully loaded.
Chevrolet Suburban Engine, Transmission, and Performance Numbers
Chevrolet Suburban is powered by a 5.3-liter engine with a Rear Wheel Drive powertrain that makes 355 -hp and 383 lb-ft torque. The transmission on the Chevrolet Suburban is an.
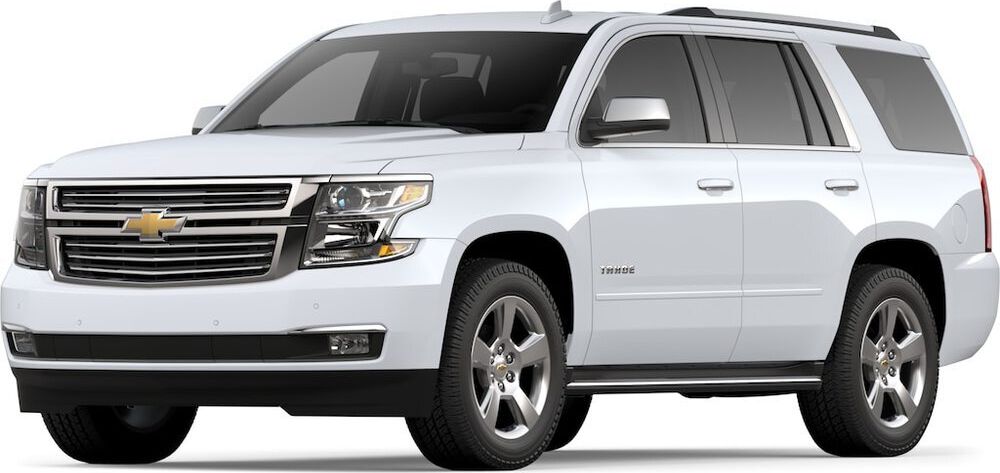
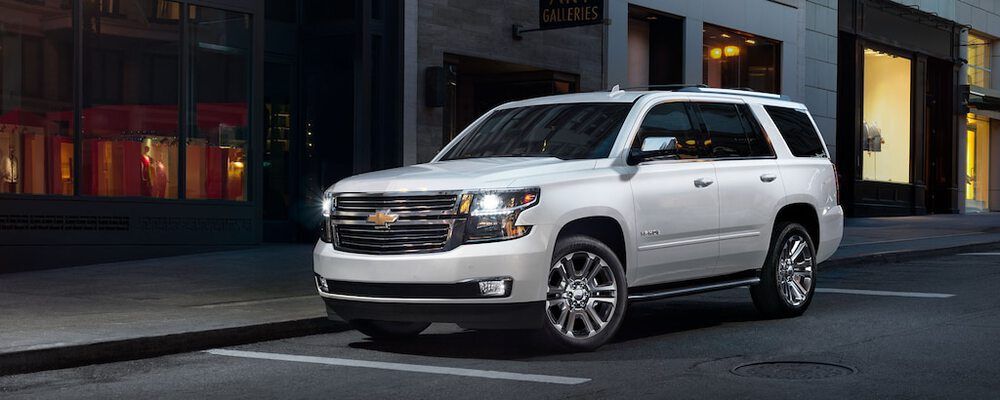
List of Chevrolet Suburban Competitors
Some of Chevrolet Suburban competitors include the Chevrolet Tahoe, Ford Expedition and GMC Yukon XL.
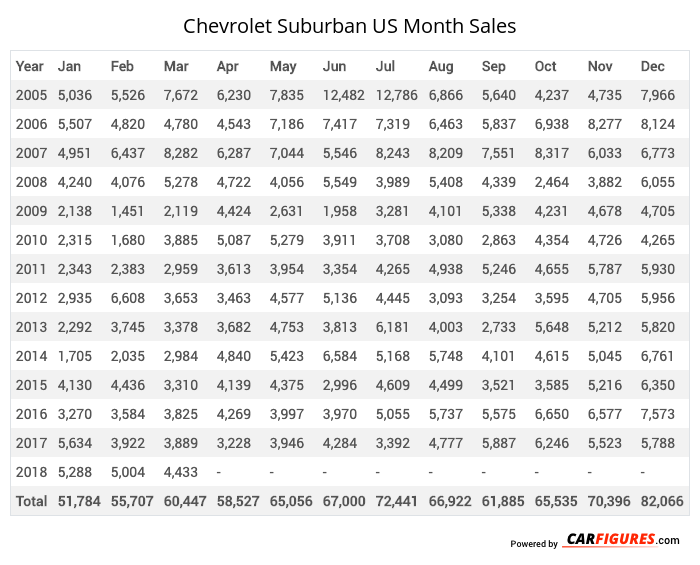
Chevrolet Suburban United States Sale figures by year, quarter, and month are presented below. Including the most up to date sales data for the Chevrolet Suburban. See how the Chevrolet Suburban stacks up the other models in the Crossover/SUVS, Large SUVs segments.
Year | Jan | Feb | Mar | Apr | May | Jun | Jul | Aug | Sep | Oct | Nov | Dec |
|---|---|---|---|---|---|---|---|---|---|---|---|---|
| 2005 | 5,036 | 5,526 | 7,672 | 6,230 | 7,835 | 12,482 | 12,786 | 6,866 | 5,640 | 4,237 | 4,735 | 7,966 |
| 2006 | 5,507 | 4,820 | 4,780 | 4,543 | 7,186 | 7,417 | 7,319 | 6,463 | 5,837 | 6,938 | 8,277 | 8,124 |
| 2007 | 4,951 | 6,437 | 8,282 | 6,287 | 7,044 | 5,546 | 8,243 | 8,209 | 7,551 | 8,317 | 6,033 | 6,773 |
| 2008 | 4,240 | 4,076 | 5,278 | 4,722 | 4,056 | 5,549 | 3,989 | 5,408 | 4,339 | 2,464 | 3,882 | 6,055 |
| 2009 | 2,138 | 1,451 | 2,119 | 4,424 | 2,631 | 1,958 | 3,281 | 4,101 | 5,338 | 4,231 | 4,678 | 4,705 |
| 2010 | 2,315 | 1,680 | 3,885 | 5,087 | 5,279 | 3,911 | 3,708 | 3,080 | 2,863 | 4,354 | 4,726 | 4,265 |
| 2011 | 2,343 | 2,383 | 2,959 | 3,613 | 3,954 | 3,354 | 4,265 | 4,938 | 5,246 | 4,655 | 5,787 | 5,930 |
| 2012 | 2,935 | 6,608 | 3,653 | 3,463 | 4,577 | 5,136 | 4,445 | 3,093 | 3,254 | 3,595 | 4,705 | 5,956 |
| 2013 | 2,292 | 3,745 | 3,378 | 3,682 | 4,753 | 3,813 | 6,181 | 4,003 | 2,733 | 5,648 | 5,212 | 5,820 |
| 2014 | 1,705 | 2,035 | 2,984 | 4,840 | 5,423 | 6,584 | 5,168 | 5,748 | 4,101 | 4,615 | 5,045 | 6,761 |
| 2015 | 4,130 | 4,436 | 3,310 | 4,139 | 4,375 | 2,996 | 4,609 | 4,499 | 3,521 | 3,585 | 5,216 | 6,350 |
| 2016 | 3,270 | 3,584 | 3,825 | 4,269 | 3,997 | 3,970 | 5,055 | 5,737 | 5,575 | 6,650 | 6,577 | 7,573 |
| 2017 | 5,634 | 3,922 | 3,889 | 3,228 | 3,946 | 4,284 | 3,392 | 4,777 | 5,887 | 6,246 | 5,523 | 5,788 |
| 2018 | 5,288 | 5,004 | 4,433 | - | - | - | - | - | - | - | - | - |
| Total | 51,784 | 55,707 | 60,447 | 58,527 | 65,056 | 67,000 | 72,441 | 66,922 | 61,885 | 65,535 | 70,396 | 82,066 |
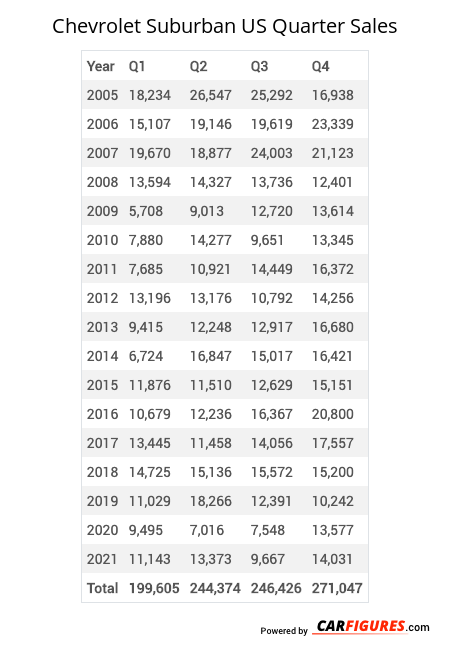
Year | Q1 | Q2 | Q3 | Q4 |
|---|---|---|---|---|
| 2005 | 18,234 | 26,547 | 25,292 | 16,938 |
| 2006 | 15,107 | 19,146 | 19,619 | 23,339 |
| 2007 | 19,670 | 18,877 | 24,003 | 21,123 |
| 2008 | 13,594 | 14,327 | 13,736 | 12,401 |
| 2009 | 5,708 | 9,013 | 12,720 | 13,614 |
| 2010 | 7,880 | 14,277 | 9,651 | 13,345 |
| 2011 | 7,685 | 10,921 | 14,449 | 16,372 |
| 2012 | 13,196 | 13,176 | 10,792 | 14,256 |
| 2013 | 9,415 | 12,248 | 12,917 | 16,680 |
| 2014 | 6,724 | 16,847 | 15,017 | 16,421 |
| 2015 | 11,876 | 11,510 | 12,629 | 15,151 |
| 2016 | 10,679 | 12,236 | 16,367 | 20,800 |
| 2017 | 13,445 | 11,458 | 14,056 | 17,557 |
| 2018 | 14,725 | 15,136 | 15,572 | 15,200 |
| 2019 | 11,029 | 18,266 | 12,391 | 10,242 |
| 2020 | 9,495 | 7,016 | 7,548 | 13,577 |
| 2021 | 11,143 | 13,373 | 9,667 | 14,031 |
| 2022 | 12,425 | 8,897 | 13,585 | 16,044 |
| 2023 | 13,933 | 16,661 | 0 | 10,144 |
| 2024 | 9,685 | 11,778 | 9,050 | 13,887 |
| 2025 | - | - | - | - |
| Total | 235,648 | 281,710 | 269,061 | 311,122 |
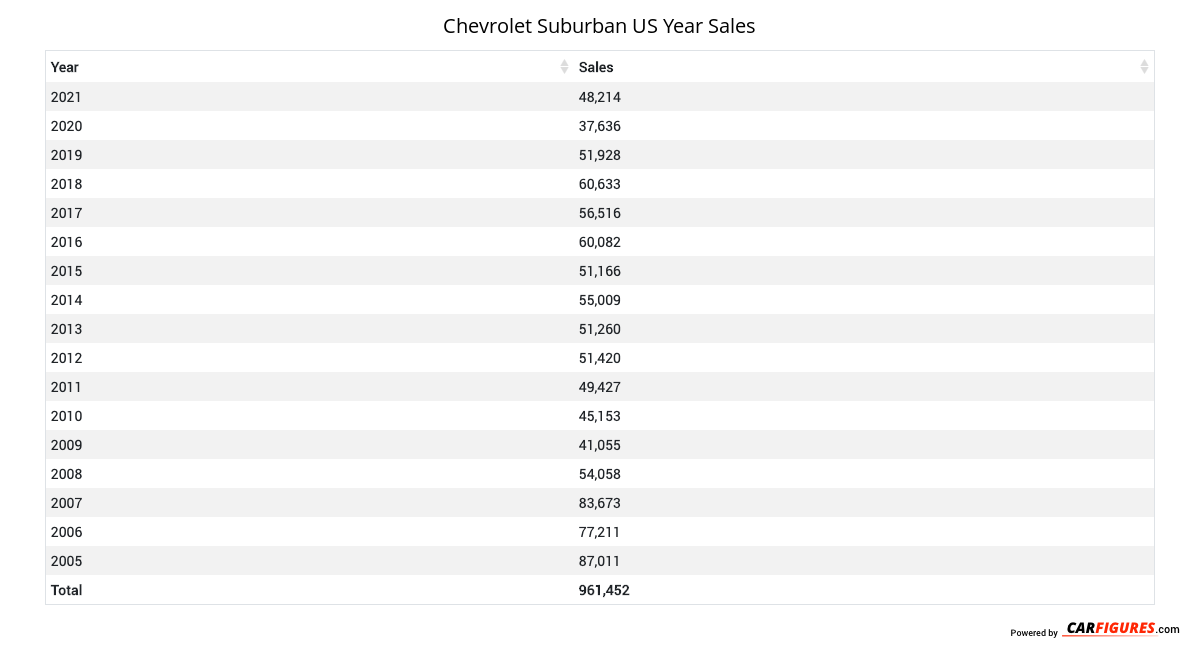
Year | Sales |
|---|---|
| 2024 | 44,400 |
| 2023 | 40,738 |
| 2022 | 50,951 |
| 2021 | 48,214 |
| 2020 | 37,636 |
| 2019 | 51,928 |
| 2018 | 60,633 |
| 2017 | 56,516 |
| 2016 | 60,082 |
| 2015 | 51,166 |
| 2014 | 55,009 |
| 2013 | 51,260 |
| 2012 | 51,420 |
| 2011 | 49,427 |
| 2010 | 45,153 |
| 2009 | 41,055 |
| 2008 | 54,058 |
| 2007 | 83,673 |
| 2006 | 77,211 |
| 2005 | 87,011 |
| Total | 1,097,541 |
Download Historic Sales Data
Embedded Code
See more widgetsSources: Manufacturers