Key Stats
How many TT did Audi sell in 2024?
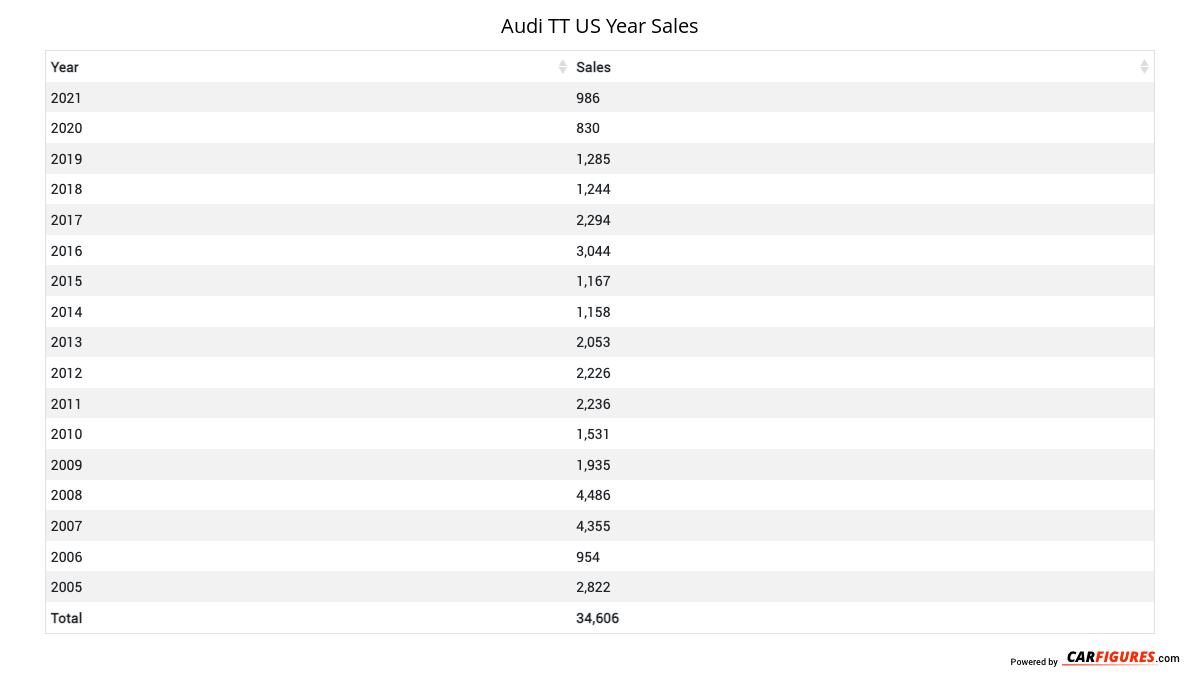
Audi sold 39 TT in 2024. In 2023, Audi sold 503 TT. They sold 464 more units in year 2023 compared to 2024 with a percent loss of 92.25% YoY.
Overview
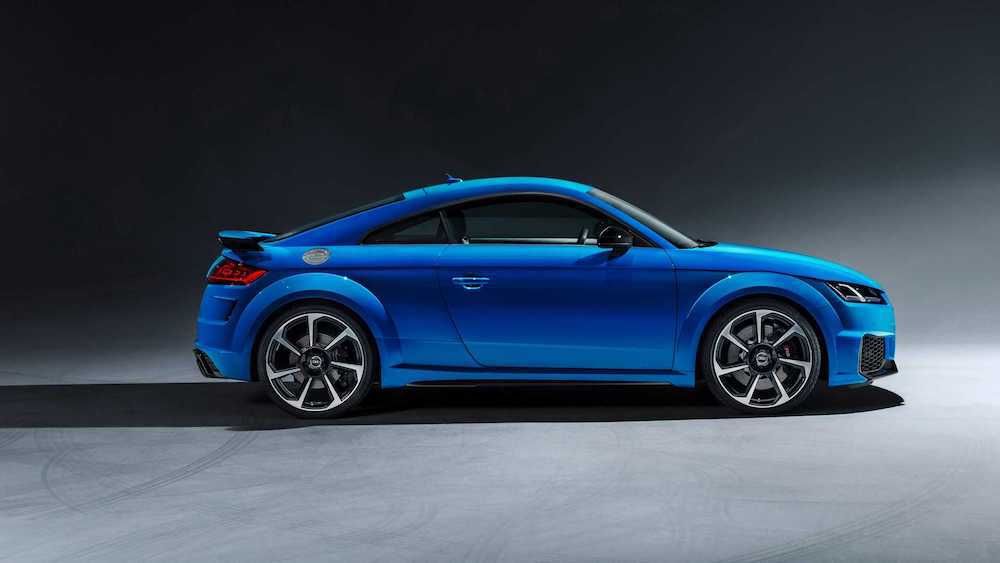
The 2022 Audi TT is a vehicle from automaker Audi.
Audi TT Engine, Transmission, and Performance Numbers
Audi TT includes a 2.0-liter engine combined with an S tronic 7-Speed Automatic. This delivers 228 hp with 258 lb-ft torque delivered through a All Wheel Drive drivetrain.
List of Audi TT Competitors
Some of Audi TT competitors include the Audi R8 and BMW Z4.
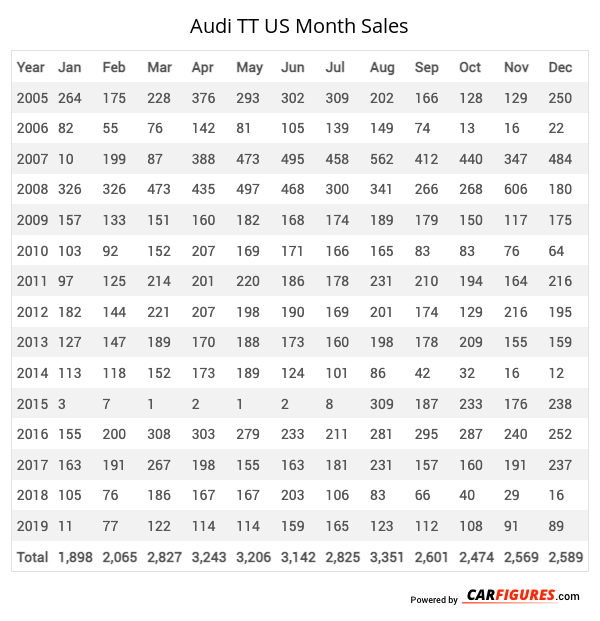
Audi TT United States Sale figures by year, quarter, and month are presented below. Including the most up to date sales data for the Audi TT. See how the Audi TT stacks up the other models in the Cars, Premium Sport/Performance Cars segments.
*Sales report includes TT Coupe, TTS Coupe, TT Roadster, TT RS
Year | Jan | Feb | Mar | Apr | May | Jun | Jul | Aug | Sep | Oct | Nov | Dec |
|---|---|---|---|---|---|---|---|---|---|---|---|---|
| 2005 | 264 | 175 | 228 | 376 | 293 | 302 | 309 | 202 | 166 | 128 | 129 | 250 |
| 2006 | 82 | 55 | 76 | 142 | 81 | 105 | 139 | 149 | 74 | 13 | 16 | 22 |
| 2007 | 10 | 199 | 87 | 388 | 473 | 495 | 458 | 562 | 412 | 440 | 347 | 484 |
| 2008 | 326 | 326 | 473 | 435 | 497 | 468 | 300 | 341 | 266 | 268 | 606 | 180 |
| 2009 | 157 | 133 | 151 | 160 | 182 | 168 | 174 | 189 | 179 | 150 | 117 | 175 |
| 2010 | 103 | 92 | 152 | 207 | 169 | 171 | 166 | 165 | 83 | 83 | 76 | 64 |
| 2011 | 97 | 125 | 214 | 201 | 220 | 186 | 178 | 231 | 210 | 194 | 164 | 216 |
| 2012 | 182 | 144 | 221 | 207 | 198 | 190 | 169 | 201 | 174 | 129 | 216 | 195 |
| 2013 | 127 | 147 | 189 | 170 | 188 | 173 | 160 | 198 | 178 | 209 | 155 | 159 |
| 2014 | 113 | 118 | 152 | 173 | 189 | 124 | 101 | 86 | 42 | 32 | 16 | 12 |
| 2015 | 3 | 7 | 1 | 2 | 1 | 2 | 8 | 309 | 187 | 233 | 176 | 238 |
| 2016 | 155 | 200 | 308 | 303 | 279 | 233 | 211 | 281 | 295 | 287 | 240 | 252 |
| 2017 | 163 | 191 | 267 | 198 | 155 | 163 | 181 | 231 | 157 | 160 | 191 | 237 |
| 2018 | 105 | 76 | 186 | 167 | 167 | 203 | 106 | 83 | 66 | 40 | 29 | 16 |
| 2019 | 11 | 77 | 122 | 114 | 114 | 159 | 165 | 123 | 112 | 108 | 91 | 89 |
| Total | 1,898 | 2,065 | 2,827 | 3,243 | 3,206 | 3,142 | 2,825 | 3,351 | 2,601 | 2,474 | 2,569 | 2,589 |
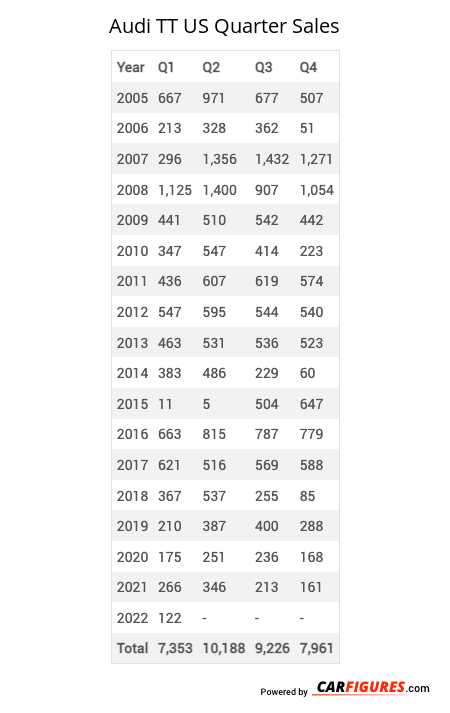
Year | Q1 | Q2 | Q3 | Q4 |
|---|---|---|---|---|
| 2005 | 667 | 971 | 677 | 507 |
| 2006 | 213 | 328 | 362 | 51 |
| 2007 | 296 | 1,356 | 1,432 | 1,271 |
| 2008 | 1,125 | 1,400 | 907 | 1,054 |
| 2009 | 441 | 510 | 542 | 442 |
| 2010 | 347 | 547 | 414 | 223 |
| 2011 | 436 | 607 | 619 | 574 |
| 2012 | 547 | 595 | 544 | 540 |
| 2013 | 463 | 531 | 536 | 523 |
| 2014 | 383 | 486 | 229 | 60 |
| 2015 | 11 | 5 | 504 | 647 |
| 2016 | 663 | 815 | 787 | 779 |
| 2017 | 621 | 516 | 569 | 588 |
| 2018 | 367 | 537 | 255 | 85 |
| 2019 | 210 | 387 | 400 | 288 |
| 2020 | 175 | 251 | 236 | 168 |
| 2021 | 266 | 346 | 213 | 161 |
| 2022 | 122 | 122 | 102 | 115 |
| 2023 | 183 | 208 | 0 | 112 |
| 2024 | 36 | 3 | 0 | 0 |
| 2025 | - | - | - | - |
| Total | 7,572 | 10,521 | 9,328 | 8,188 |
Year | Sales |
|---|---|
| 2024 | 39 |
| 2023 | 503 |
| 2022 | 461 |
| 2021 | 986 |
| 2020 | 830 |
| 2019 | 1,285 |
| 2018 | 1,244 |
| 2017 | 2,294 |
| 2016 | 3,044 |
| 2015 | 1,167 |
| 2014 | 1,158 |
| 2013 | 2,053 |
| 2012 | 2,226 |
| 2011 | 2,236 |
| 2010 | 1,531 |
| 2009 | 1,935 |
| 2008 | 4,486 |
| 2007 | 4,355 |
| 2006 | 954 |
| 2005 | 2,822 |
| Total | 35,609 |
Download Historic Sales Data
Embedded Code
See more widgetsSources: Manufacturers