Key Stats
How many A7/S7 did Audi sell in 2024?
Audi sold 1,042 A7/S7 in 2024. In 2023, Audi sold 1,430 A7/S7. They sold 388 more units in year 2023 compared to 2024 with a percent loss of 27.13% YoY.
Overview
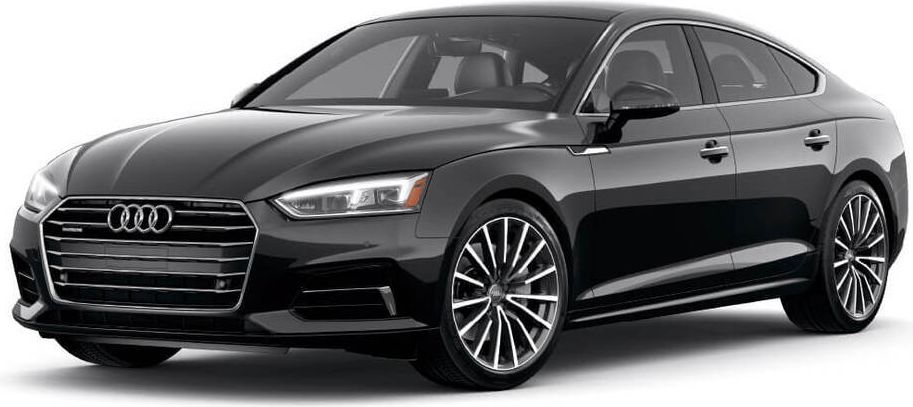
The 2022 Audi A7 is a vehicle from automaker Audi.
How Much Does the 2022 Audi A7 Cost?
Pricing for the 2022 Audi A7 starts at $69,200 MSRP and goes up to $69,200 fully loaded.
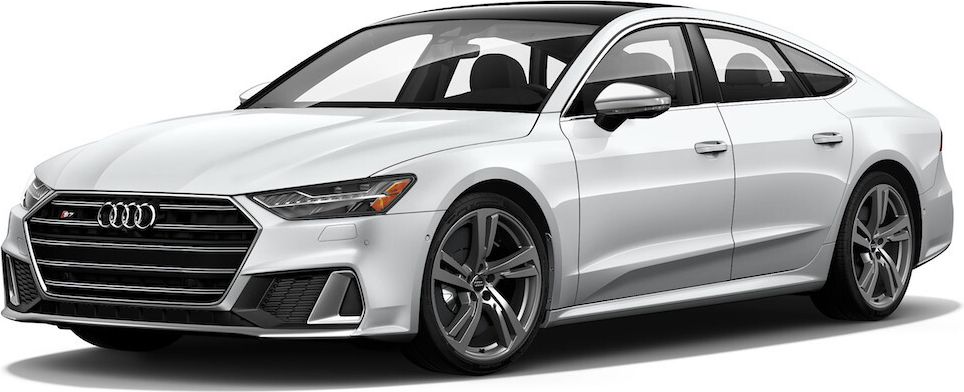
Audi A7 Engine, Transmission, and Performance Numbers
Audi A7 is powered by a 3.0-liter engine with a All Wheel Drive powertrain that makes 335 -hp and 369 lb-ft torque. The transmission on the Audi A7 is an 7-Speed S tronic.
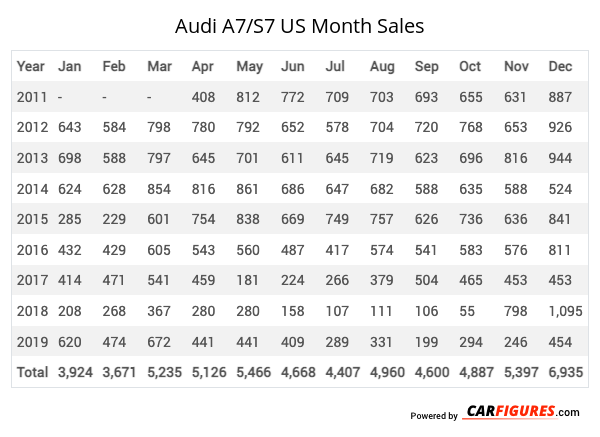
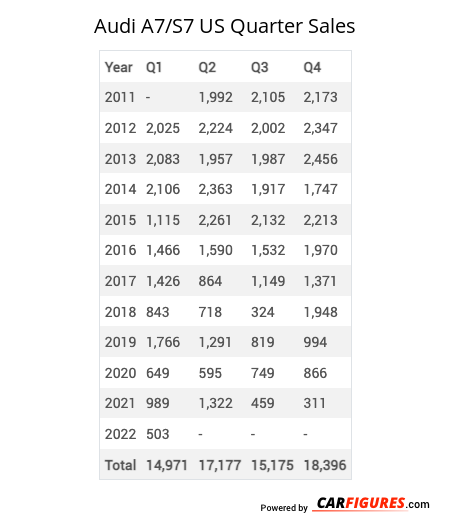
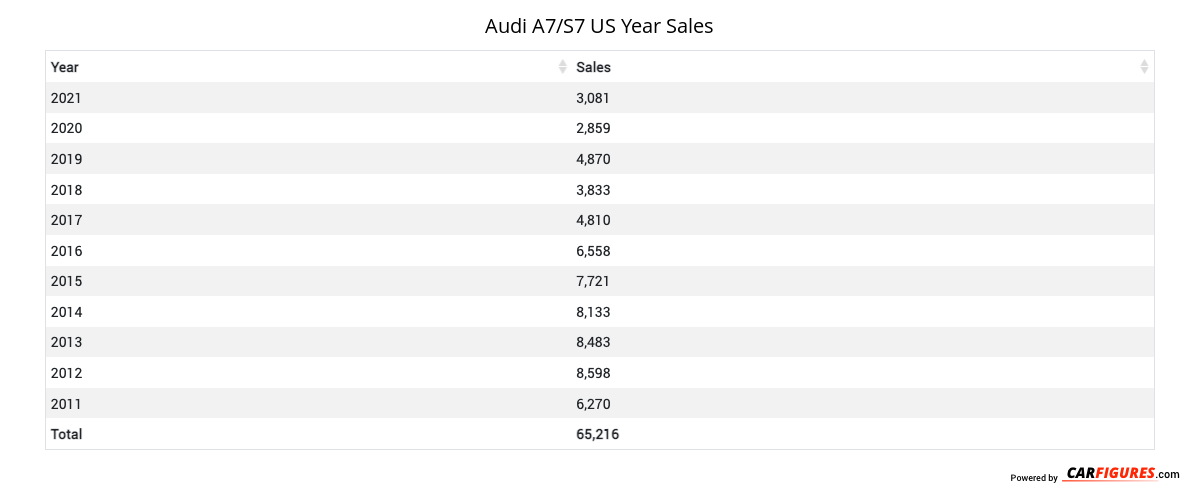
Audi A7/S7 United States Sale figures by year, quarter, and month are presented below. Including the most up to date sales data for the Audi A7/S7. See how the Audi A7/S7 stacks up the other models in the Cars, Premium Midsize Cars segments.
*Sales report includes A7 Sedan, S7 Sedan, RS 7 Sedan
Year | Jan | Feb | Mar | Apr | May | Jun | Jul | Aug | Sep | Oct | Nov | Dec |
|---|---|---|---|---|---|---|---|---|---|---|---|---|
| 2011 | - | - | - | 408 | 812 | 772 | 709 | 703 | 693 | 655 | 631 | 887 |
| 2012 | 643 | 584 | 798 | 780 | 792 | 652 | 578 | 704 | 720 | 768 | 653 | 926 |
| 2013 | 698 | 588 | 797 | 645 | 701 | 611 | 645 | 719 | 623 | 696 | 816 | 944 |
| 2014 | 624 | 628 | 854 | 816 | 861 | 686 | 647 | 682 | 588 | 635 | 588 | 524 |
| 2015 | 285 | 229 | 601 | 754 | 838 | 669 | 749 | 757 | 626 | 736 | 636 | 841 |
| 2016 | 432 | 429 | 605 | 543 | 560 | 487 | 417 | 574 | 541 | 583 | 576 | 811 |
| 2017 | 414 | 471 | 541 | 459 | 181 | 224 | 266 | 379 | 504 | 465 | 453 | 453 |
| 2018 | 208 | 268 | 367 | 280 | 280 | 158 | 107 | 111 | 106 | 55 | 798 | 1,095 |
| 2019 | 620 | 474 | 672 | 441 | 441 | 409 | 289 | 331 | 199 | 294 | 246 | 454 |
| Total | 3,924 | 3,671 | 5,235 | 5,126 | 5,466 | 4,668 | 4,407 | 4,960 | 4,600 | 4,887 | 5,397 | 6,935 |
Year | Q1 | Q2 | Q3 | Q4 |
|---|---|---|---|---|
| 2011 | - | 1,992 | 2,105 | 2,173 |
| 2012 | 2,025 | 2,224 | 2,002 | 2,347 |
| 2013 | 2,083 | 1,957 | 1,987 | 2,456 |
| 2014 | 2,106 | 2,363 | 1,917 | 1,747 |
| 2015 | 1,115 | 2,261 | 2,132 | 2,213 |
| 2016 | 1,466 | 1,590 | 1,532 | 1,970 |
| 2017 | 1,426 | 864 | 1,149 | 1,371 |
| 2018 | 843 | 718 | 324 | 1,948 |
| 2019 | 1,766 | 1,291 | 819 | 994 |
| 2020 | 649 | 595 | 749 | 866 |
| 2021 | 989 | 1,322 | 459 | 311 |
| 2022 | 503 | 638 | 577 | 522 |
| 2023 | 544 | 311 | 0 | 575 |
| 2024 | 489 | 249 | 304 | 0 |
| 2025 | - | - | - | - |
| Total | 16,004 | 18,375 | 16,056 | 19,493 |
Year | Sales |
|---|---|
| 2024 | 1,042 |
| 2023 | 1,430 |
| 2022 | 2,240 |
| 2021 | 3,081 |
| 2020 | 2,859 |
| 2019 | 4,870 |
| 2018 | 3,833 |
| 2017 | 4,810 |
| 2016 | 6,558 |
| 2015 | 7,721 |
| 2014 | 8,133 |
| 2013 | 8,483 |
| 2012 | 8,598 |
| 2011 | 6,270 |
| Total | 69,928 |
Download Historic Sales Data
Embedded Code
See more widgetsSources: Manufacturers