Key Stats
How many A3/S3 did Audi sell in 2024?
Audi sold 8,415 A3/S3 in 2024. In 2023, Audi sold 10,818 A3/S3. They sold 2,403 more units in year 2023 compared to 2024 with a percent loss of 22.21% YoY.
Overview
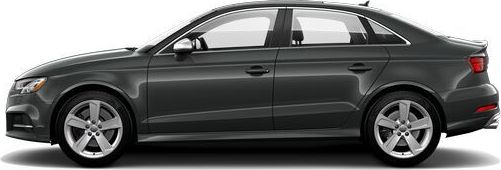
The 2022 Audi A3 is a vehicle from automaker Audi.
How Much Does the 2022 Audi A3 Cost?
Pricing for the 2022 Audi A3 starts at $33,900 MSRP and goes up to $35,900 fully loaded.
Audi A3 Engine, Transmission, and Performance Numbers
Audi A3 includes a 2.0-liter engine combined with a 7-Spd S tronic Dual-Clutch Automatic. This delivers 201 hp with 221 lb-ft torque delivered through a Front Wheel Drive drivetrain.
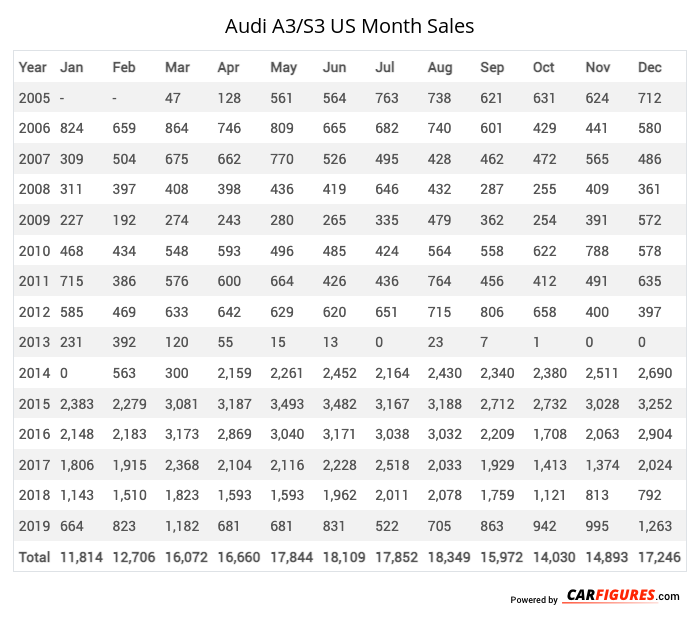
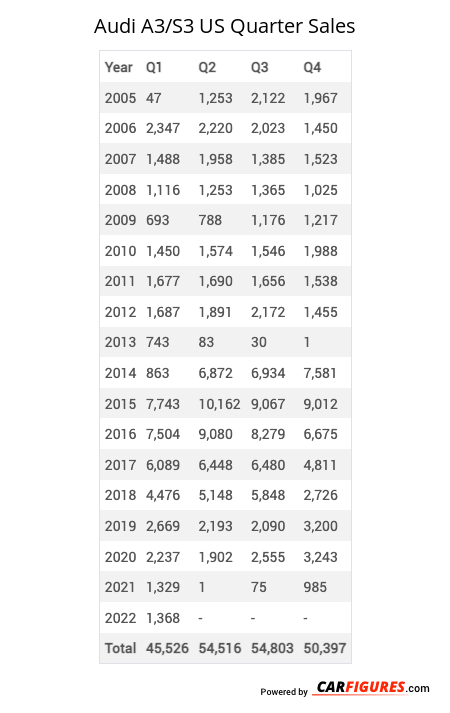
Audi A3/S3 United States Sale figures by year, quarter, and month are presented below. Including the most up to date sales data for the Audi A3/S3. See how the Audi A3/S3 stacks up the other models in the Cars, Premium Compact Cars segments.
*Sales report includes A3 Sedan, S3 Sedan, A3 Cabriolet, A3 Sportback e-tron, RS 3
Year | Jan | Feb | Mar | Apr | May | Jun | Jul | Aug | Sep | Oct | Nov | Dec |
|---|---|---|---|---|---|---|---|---|---|---|---|---|
| 2005 | - | - | 47 | 128 | 561 | 564 | 763 | 738 | 621 | 631 | 624 | 712 |
| 2006 | 824 | 659 | 864 | 746 | 809 | 665 | 682 | 740 | 601 | 429 | 441 | 580 |
| 2007 | 309 | 504 | 675 | 662 | 770 | 526 | 495 | 428 | 462 | 472 | 565 | 486 |
| 2008 | 311 | 397 | 408 | 398 | 436 | 419 | 646 | 432 | 287 | 255 | 409 | 361 |
| 2009 | 227 | 192 | 274 | 243 | 280 | 265 | 335 | 479 | 362 | 254 | 391 | 572 |
| 2010 | 468 | 434 | 548 | 593 | 496 | 485 | 424 | 564 | 558 | 622 | 788 | 578 |
| 2011 | 715 | 386 | 576 | 600 | 664 | 426 | 436 | 764 | 456 | 412 | 491 | 635 |
| 2012 | 585 | 469 | 633 | 642 | 629 | 620 | 651 | 715 | 806 | 658 | 400 | 397 |
| 2013 | 231 | 392 | 120 | 55 | 15 | 13 | 0 | 23 | 7 | 1 | 0 | 0 |
| 2014 | 0 | 563 | 300 | 2,159 | 2,261 | 2,452 | 2,164 | 2,430 | 2,340 | 2,380 | 2,511 | 2,690 |
| 2015 | 2,383 | 2,279 | 3,081 | 3,187 | 3,493 | 3,482 | 3,167 | 3,188 | 2,712 | 2,732 | 3,028 | 3,252 |
| 2016 | 2,148 | 2,183 | 3,173 | 2,869 | 3,040 | 3,171 | 3,038 | 3,032 | 2,209 | 1,708 | 2,063 | 2,904 |
| 2017 | 1,806 | 1,915 | 2,368 | 2,104 | 2,116 | 2,228 | 2,518 | 2,033 | 1,929 | 1,413 | 1,374 | 2,024 |
| 2018 | 1,143 | 1,510 | 1,823 | 1,593 | 1,593 | 1,962 | 2,011 | 2,078 | 1,759 | 1,121 | 813 | 792 |
| 2019 | 664 | 823 | 1,182 | 681 | 681 | 831 | 522 | 705 | 863 | 942 | 995 | 1,263 |
| Total | 11,814 | 12,706 | 16,072 | 16,660 | 17,844 | 18,109 | 17,852 | 18,349 | 15,972 | 14,030 | 14,893 | 17,246 |
Year | Q1 | Q2 | Q3 | Q4 |
|---|---|---|---|---|
| 2005 | 47 | 1,253 | 2,122 | 1,967 |
| 2006 | 2,347 | 2,220 | 2,023 | 1,450 |
| 2007 | 1,488 | 1,958 | 1,385 | 1,523 |
| 2008 | 1,116 | 1,253 | 1,365 | 1,025 |
| 2009 | 693 | 788 | 1,176 | 1,217 |
| 2010 | 1,450 | 1,574 | 1,546 | 1,988 |
| 2011 | 1,677 | 1,690 | 1,656 | 1,538 |
| 2012 | 1,687 | 1,891 | 2,172 | 1,455 |
| 2013 | 743 | 83 | 30 | 1 |
| 2014 | 863 | 6,872 | 6,934 | 7,581 |
| 2015 | 7,743 | 10,162 | 9,067 | 9,012 |
| 2016 | 7,504 | 9,080 | 8,279 | 6,675 |
| 2017 | 6,089 | 6,448 | 6,480 | 4,811 |
| 2018 | 4,476 | 5,148 | 5,848 | 2,726 |
| 2019 | 2,669 | 2,193 | 2,090 | 3,200 |
| 2020 | 2,237 | 1,902 | 2,555 | 3,243 |
| 2021 | 1,329 | 1 | 75 | 985 |
| 2022 | 1,368 | 3,934 | 3,297 | 2,750 |
| 2023 | 4,068 | 3,753 | 0 | 2,997 |
| 2024 | 3,712 | 3,335 | 1,368 | 0 |
| 2025 | - | - | - | - |
| Total | 53,306 | 65,538 | 59,468 | 56,144 |
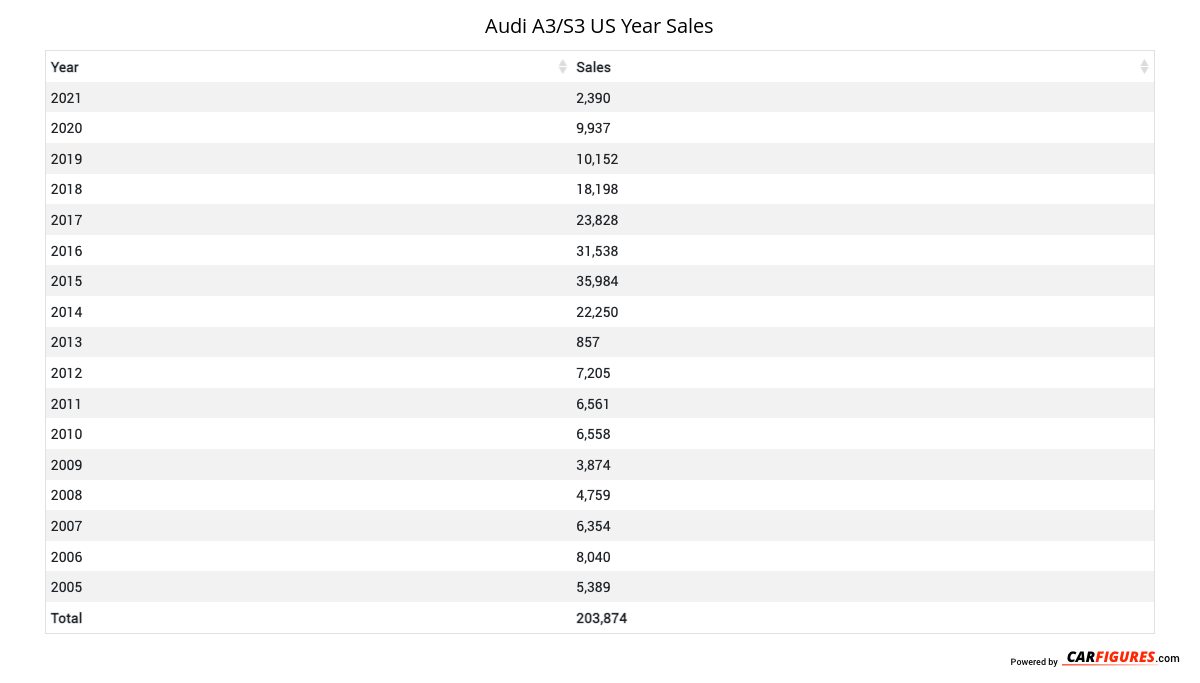
Year | Sales |
|---|---|
| 2024 | 8,415 |
| 2023 | 10,818 |
| 2022 | 11,349 |
| 2021 | 2,390 |
| 2020 | 9,937 |
| 2019 | 10,152 |
| 2018 | 18,198 |
| 2017 | 23,828 |
| 2016 | 31,538 |
| 2015 | 35,984 |
| 2014 | 22,250 |
| 2013 | 857 |
| 2012 | 7,205 |
| 2011 | 6,561 |
| 2010 | 6,558 |
| 2009 | 3,874 |
| 2008 | 4,759 |
| 2007 | 6,354 |
| 2006 | 8,040 |
| 2005 | 5,389 |
| Total | 234,456 |
Download Historic Sales Data
Embedded Code
See more widgetsSources: Manufacturers