Key Stats
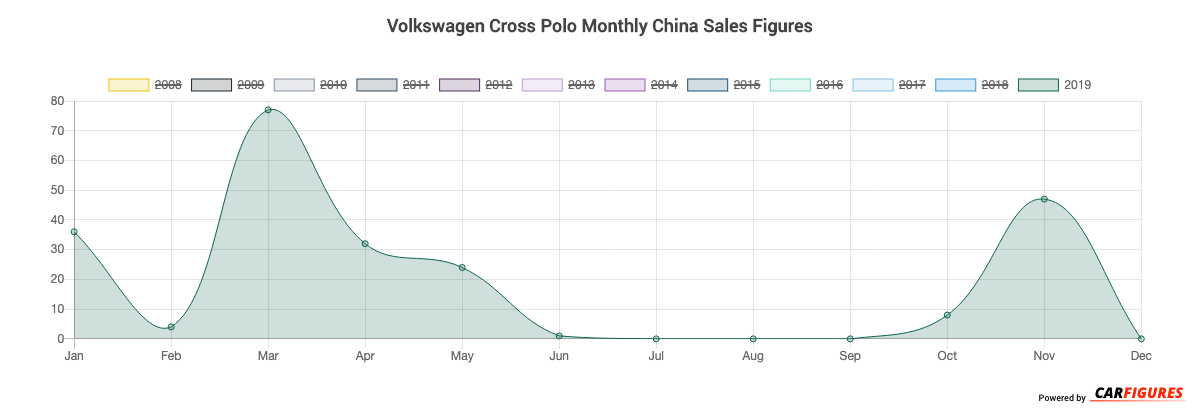
How many Cross Polo did Volkswagen sell in November 2019?
Volkswagen sold 47 Cross Polo in November 2019.
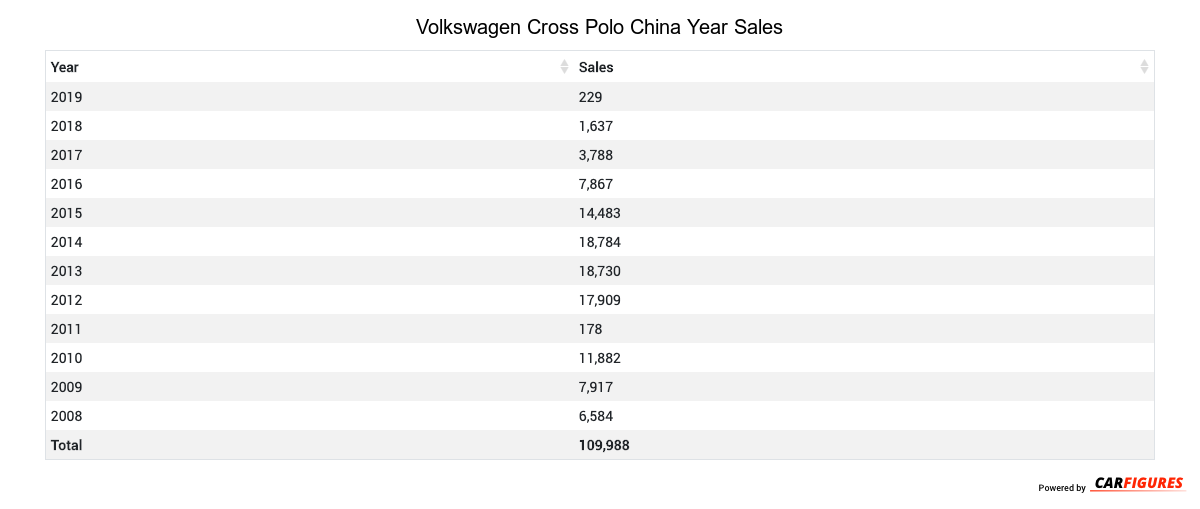
How many Cross Polo did Volkswagen sell in 2019?
Volkswagen sold 229 Cross Polo in 2019. In 2018, Volkswagen sold 1,637 Cross Polo. They sold 1,408 more units in year 2018 compared to 2019 with a percent loss of 86.01% YoY.
Overview
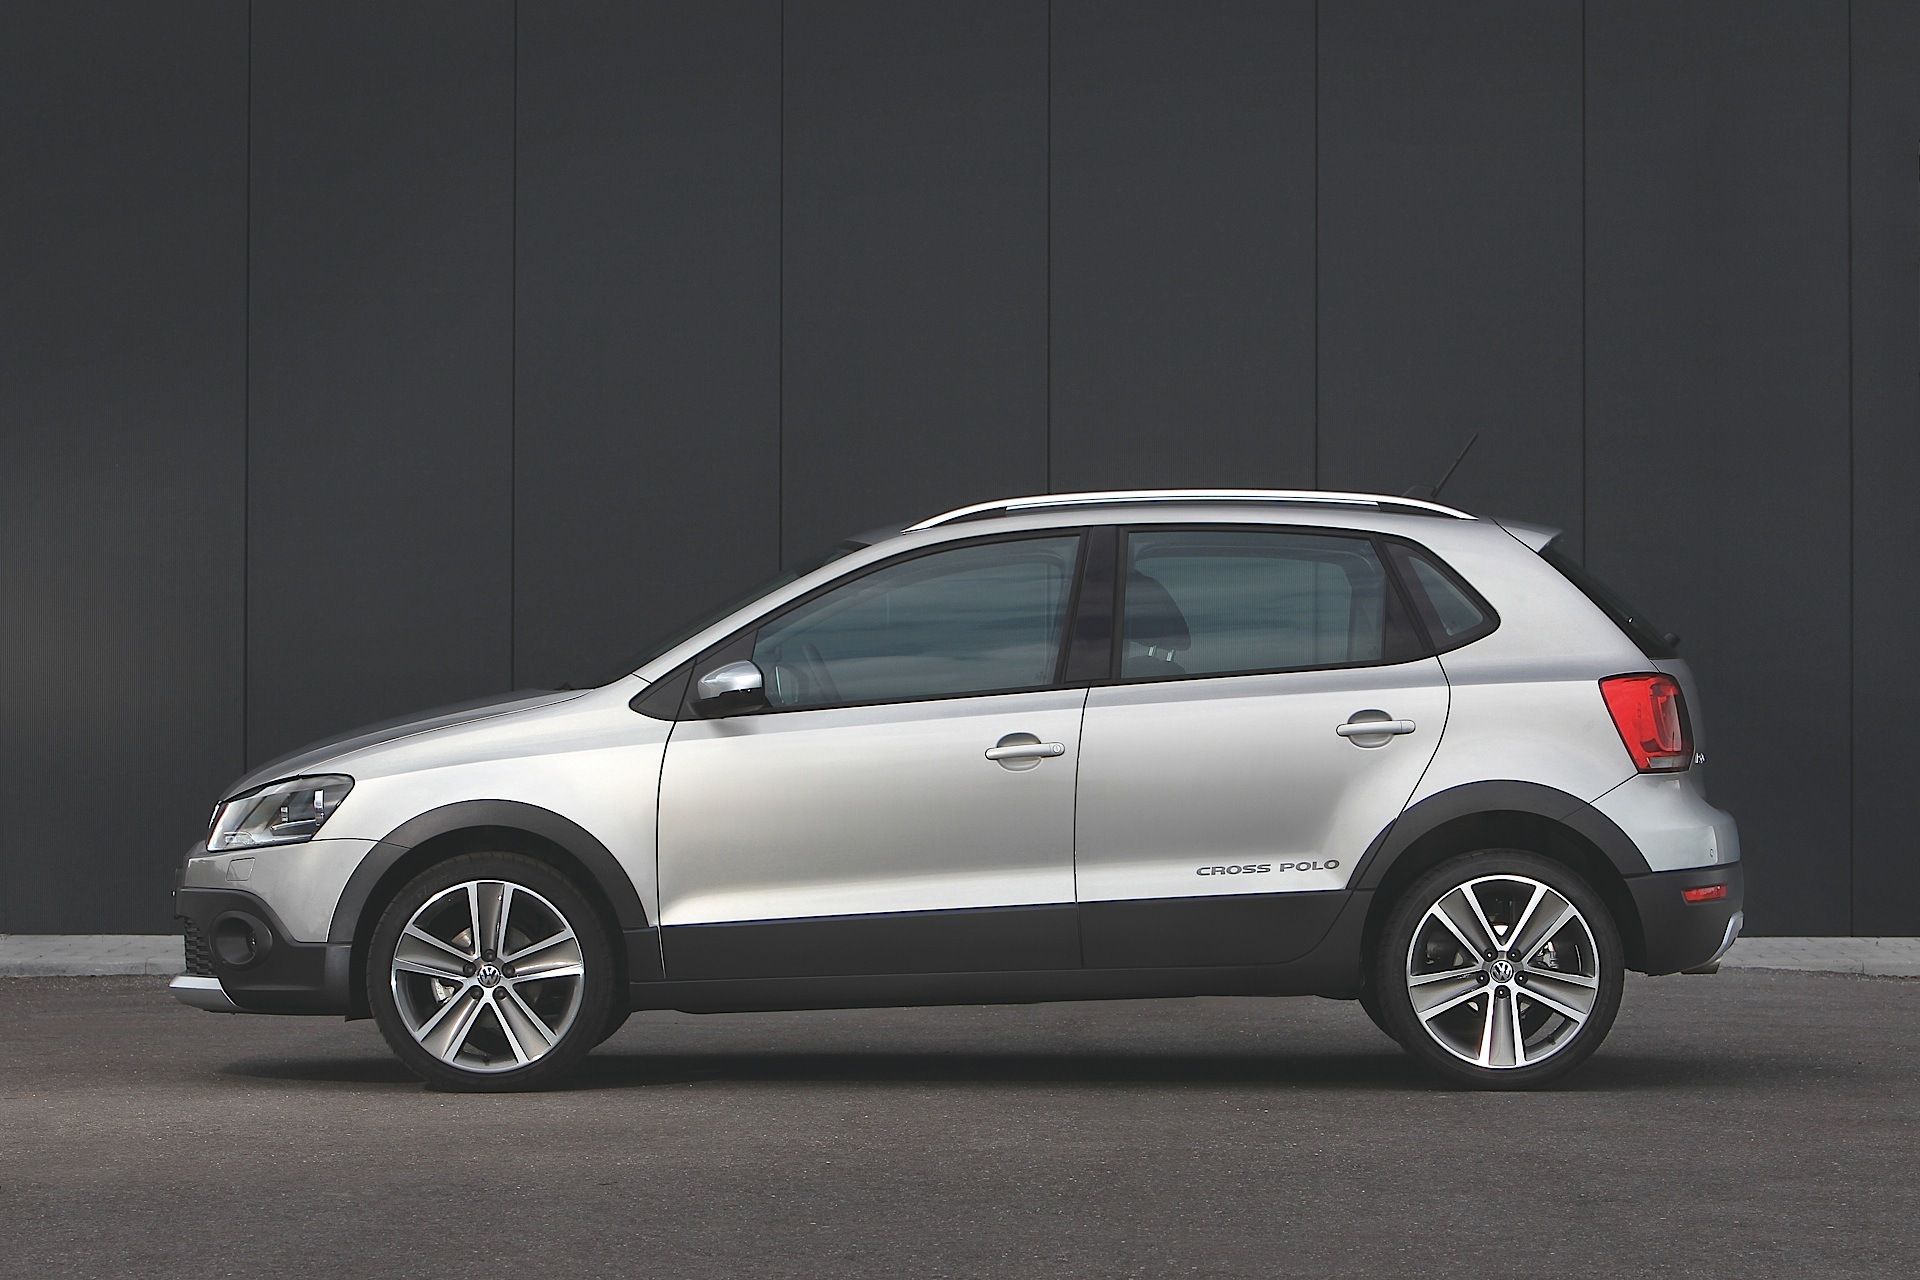
The Cross Polo is a 5-door 5-seater hatchback with room for 5 people.
How Much Does the Volkswagen Cross Polo Cost?
The Cross Polo starts at CN¥105,900 Yuan ($14,826 USD) MSRP. Fully equipped, the Cross Polo will cost you about CN¥117,900 Yuan ($16,506 USD).
Volkswagen Cross Polo Engine and Performance
Cross Polo is powered by a 1.6LL engine that makes 81 Kw (108.62 HP) - 81 Kw (108.62 HP) and 155 Nm (114.70 ft-lb) - 155 Nm (114.70 ft-lb) torque.
Volkswagen Cross Polo Specifications
The Cross Polo has a curb weight of 1,100 kg (2,400 lbs) - 1,100 kg (2,500 lbs).
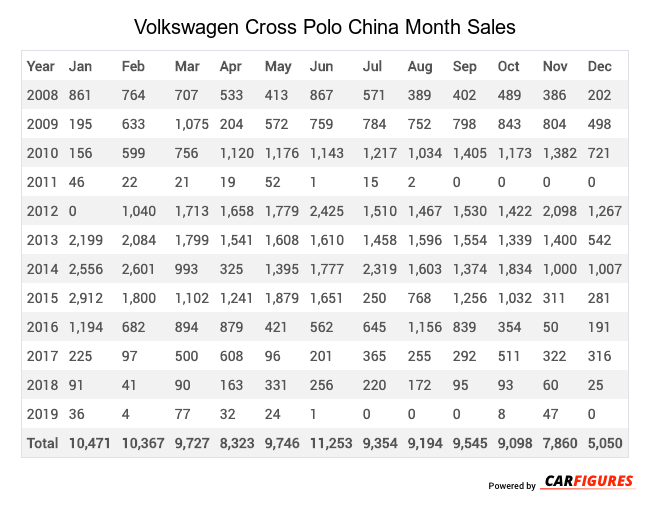
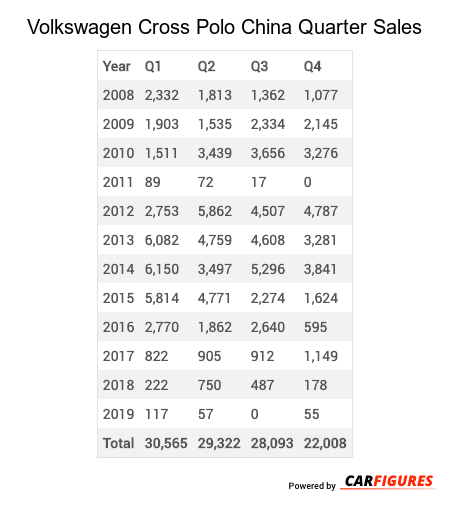
Volkswagen Cross Polo China Sale figures by year, quarter, and month are presented below. Including the most up to date sales data for the Volkswagen Cross Polo.
Year | Jan | Feb | Mar | Apr | May | Jun | Jul | Aug | Sep | Oct | Nov | Dec |
|---|---|---|---|---|---|---|---|---|---|---|---|---|
| 2008 | 861 | 764 | 707 | 533 | 413 | 867 | 571 | 389 | 402 | 489 | 386 | 202 |
| 2009 | 195 | 633 | 1,075 | 204 | 572 | 759 | 784 | 752 | 798 | 843 | 804 | 498 |
| 2010 | 156 | 599 | 756 | 1,120 | 1,176 | 1,143 | 1,217 | 1,034 | 1,405 | 1,173 | 1,382 | 721 |
| 2011 | 46 | 22 | 21 | 19 | 52 | 1 | 15 | 2 | 0 | 0 | 0 | 0 |
| 2012 | 0 | 1,040 | 1,713 | 1,658 | 1,779 | 2,425 | 1,510 | 1,467 | 1,530 | 1,422 | 2,098 | 1,267 |
| 2013 | 2,199 | 2,084 | 1,799 | 1,541 | 1,608 | 1,610 | 1,458 | 1,596 | 1,554 | 1,339 | 1,400 | 542 |
| 2014 | 2,556 | 2,601 | 993 | 325 | 1,395 | 1,777 | 2,319 | 1,603 | 1,374 | 1,834 | 1,000 | 1,007 |
| 2015 | 2,912 | 1,800 | 1,102 | 1,241 | 1,879 | 1,651 | 250 | 768 | 1,256 | 1,032 | 311 | 281 |
| 2016 | 1,194 | 682 | 894 | 879 | 421 | 562 | 645 | 1,156 | 839 | 354 | 50 | 191 |
| 2017 | 225 | 97 | 500 | 608 | 96 | 201 | 365 | 255 | 292 | 511 | 322 | 316 |
| 2018 | 91 | 41 | 90 | 163 | 331 | 256 | 220 | 172 | 95 | 93 | 60 | 25 |
| 2019 | 36 | 4 | 77 | 32 | 24 | 1 | 0 | 0 | 0 | 8 | 47 | 0 |
| Total | 10,471 | 10,367 | 9,727 | 8,323 | 9,746 | 11,253 | 9,354 | 9,194 | 9,545 | 9,098 | 7,860 | 5,050 |
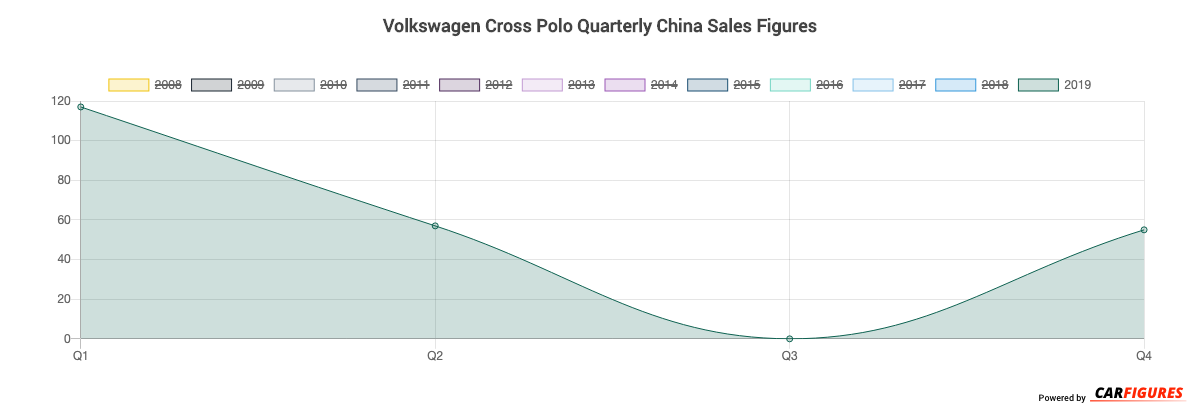
Year | Q1 | Q2 | Q3 | Q4 |
|---|---|---|---|---|
| 2008 | 2,332 | 1,813 | 1,362 | 1,077 |
| 2009 | 1,903 | 1,535 | 2,334 | 2,145 |
| 2010 | 1,511 | 3,439 | 3,656 | 3,276 |
| 2011 | 89 | 72 | 17 | 0 |
| 2012 | 2,753 | 5,862 | 4,507 | 4,787 |
| 2013 | 6,082 | 4,759 | 4,608 | 3,281 |
| 2014 | 6,150 | 3,497 | 5,296 | 3,841 |
| 2015 | 5,814 | 4,771 | 2,274 | 1,624 |
| 2016 | 2,770 | 1,862 | 2,640 | 595 |
| 2017 | 822 | 905 | 912 | 1,149 |
| 2018 | 222 | 750 | 487 | 178 |
| 2019 | 117 | 57 | 0 | 55 |
| Total | 30,565 | 29,322 | 28,093 | 22,008 |
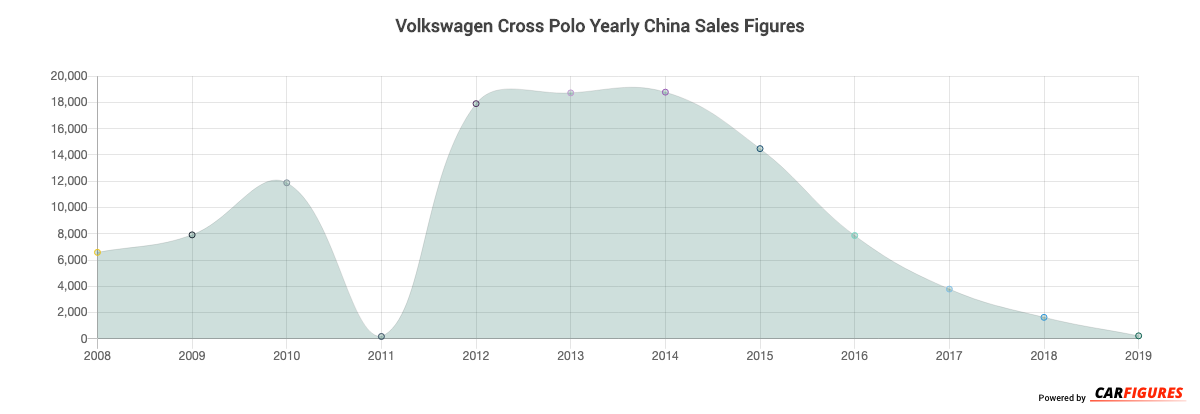
Year | Sales |
|---|---|
| 2019 | 229 |
| 2018 | 1,637 |
| 2017 | 3,788 |
| 2016 | 7,867 |
| 2015 | 14,483 |
| 2014 | 18,784 |
| 2013 | 18,730 |
| 2012 | 17,909 |
| 2011 | 178 |
| 2010 | 11,882 |
| 2009 | 7,917 |
| 2008 | 6,584 |
| Total | 109,988 |
Download Historic Sales Data
Embedded Code
See more widgetsSources: Manufacturers