Key Stats
How many CC did Volkswagen sell in 2020?
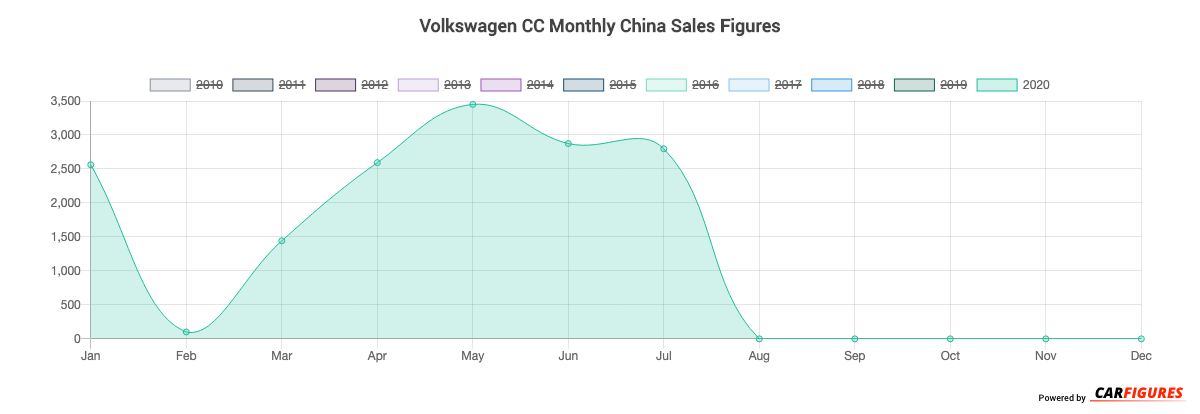
Volkswagen sold 15,819 CC in 2020. (From Jan - Dec 2020)
How many CC did Volkswagen sell in July 2020?
Volkswagen sold 2,797 CC in July 2020.
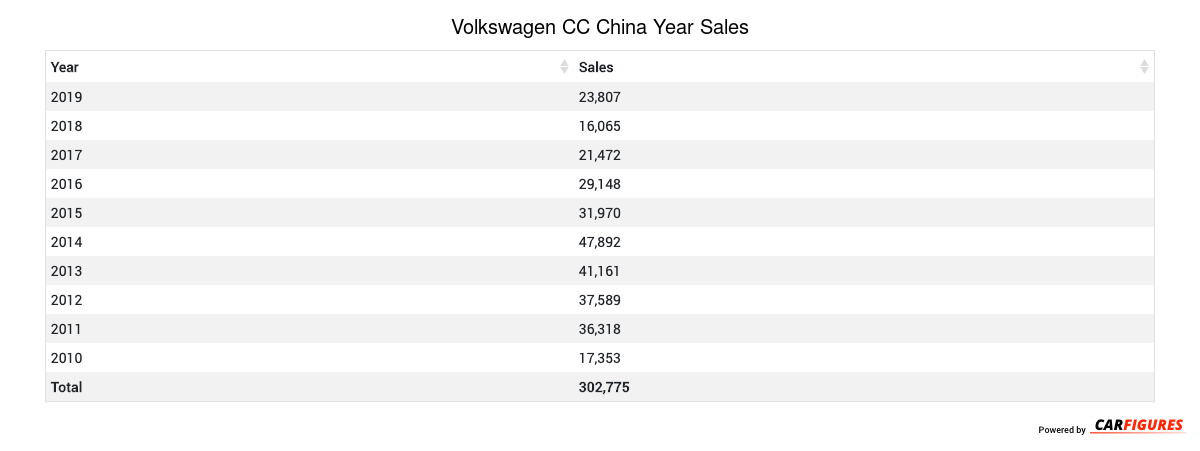
How many CC did Volkswagen sell in 2019?
Volkswagen sold 23,807 CC in 2019. In 2018, Volkswagen sold 16,065 CC. They sold 7,742 more units in 2019 compared to 2018 with a percent gain of 48.19% YoY.
Overview
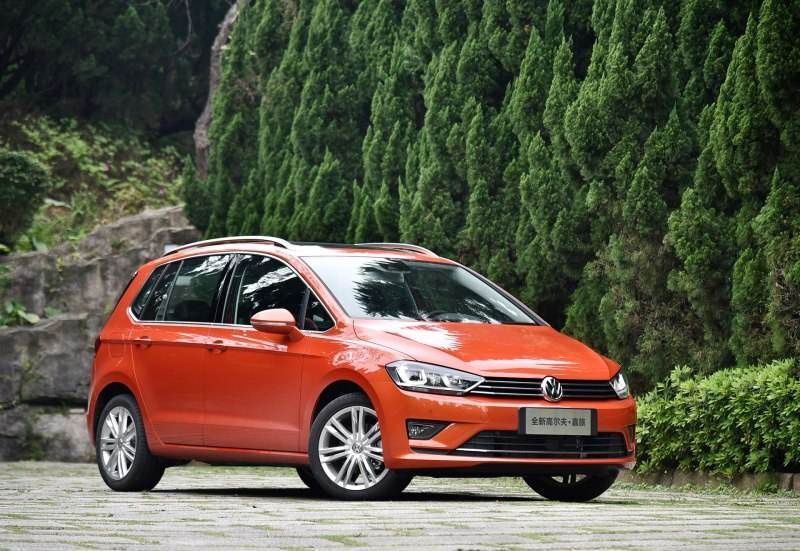
The CC is a 5-door 5-seater hatchback with room for 5 people from automaker Volkswagen.
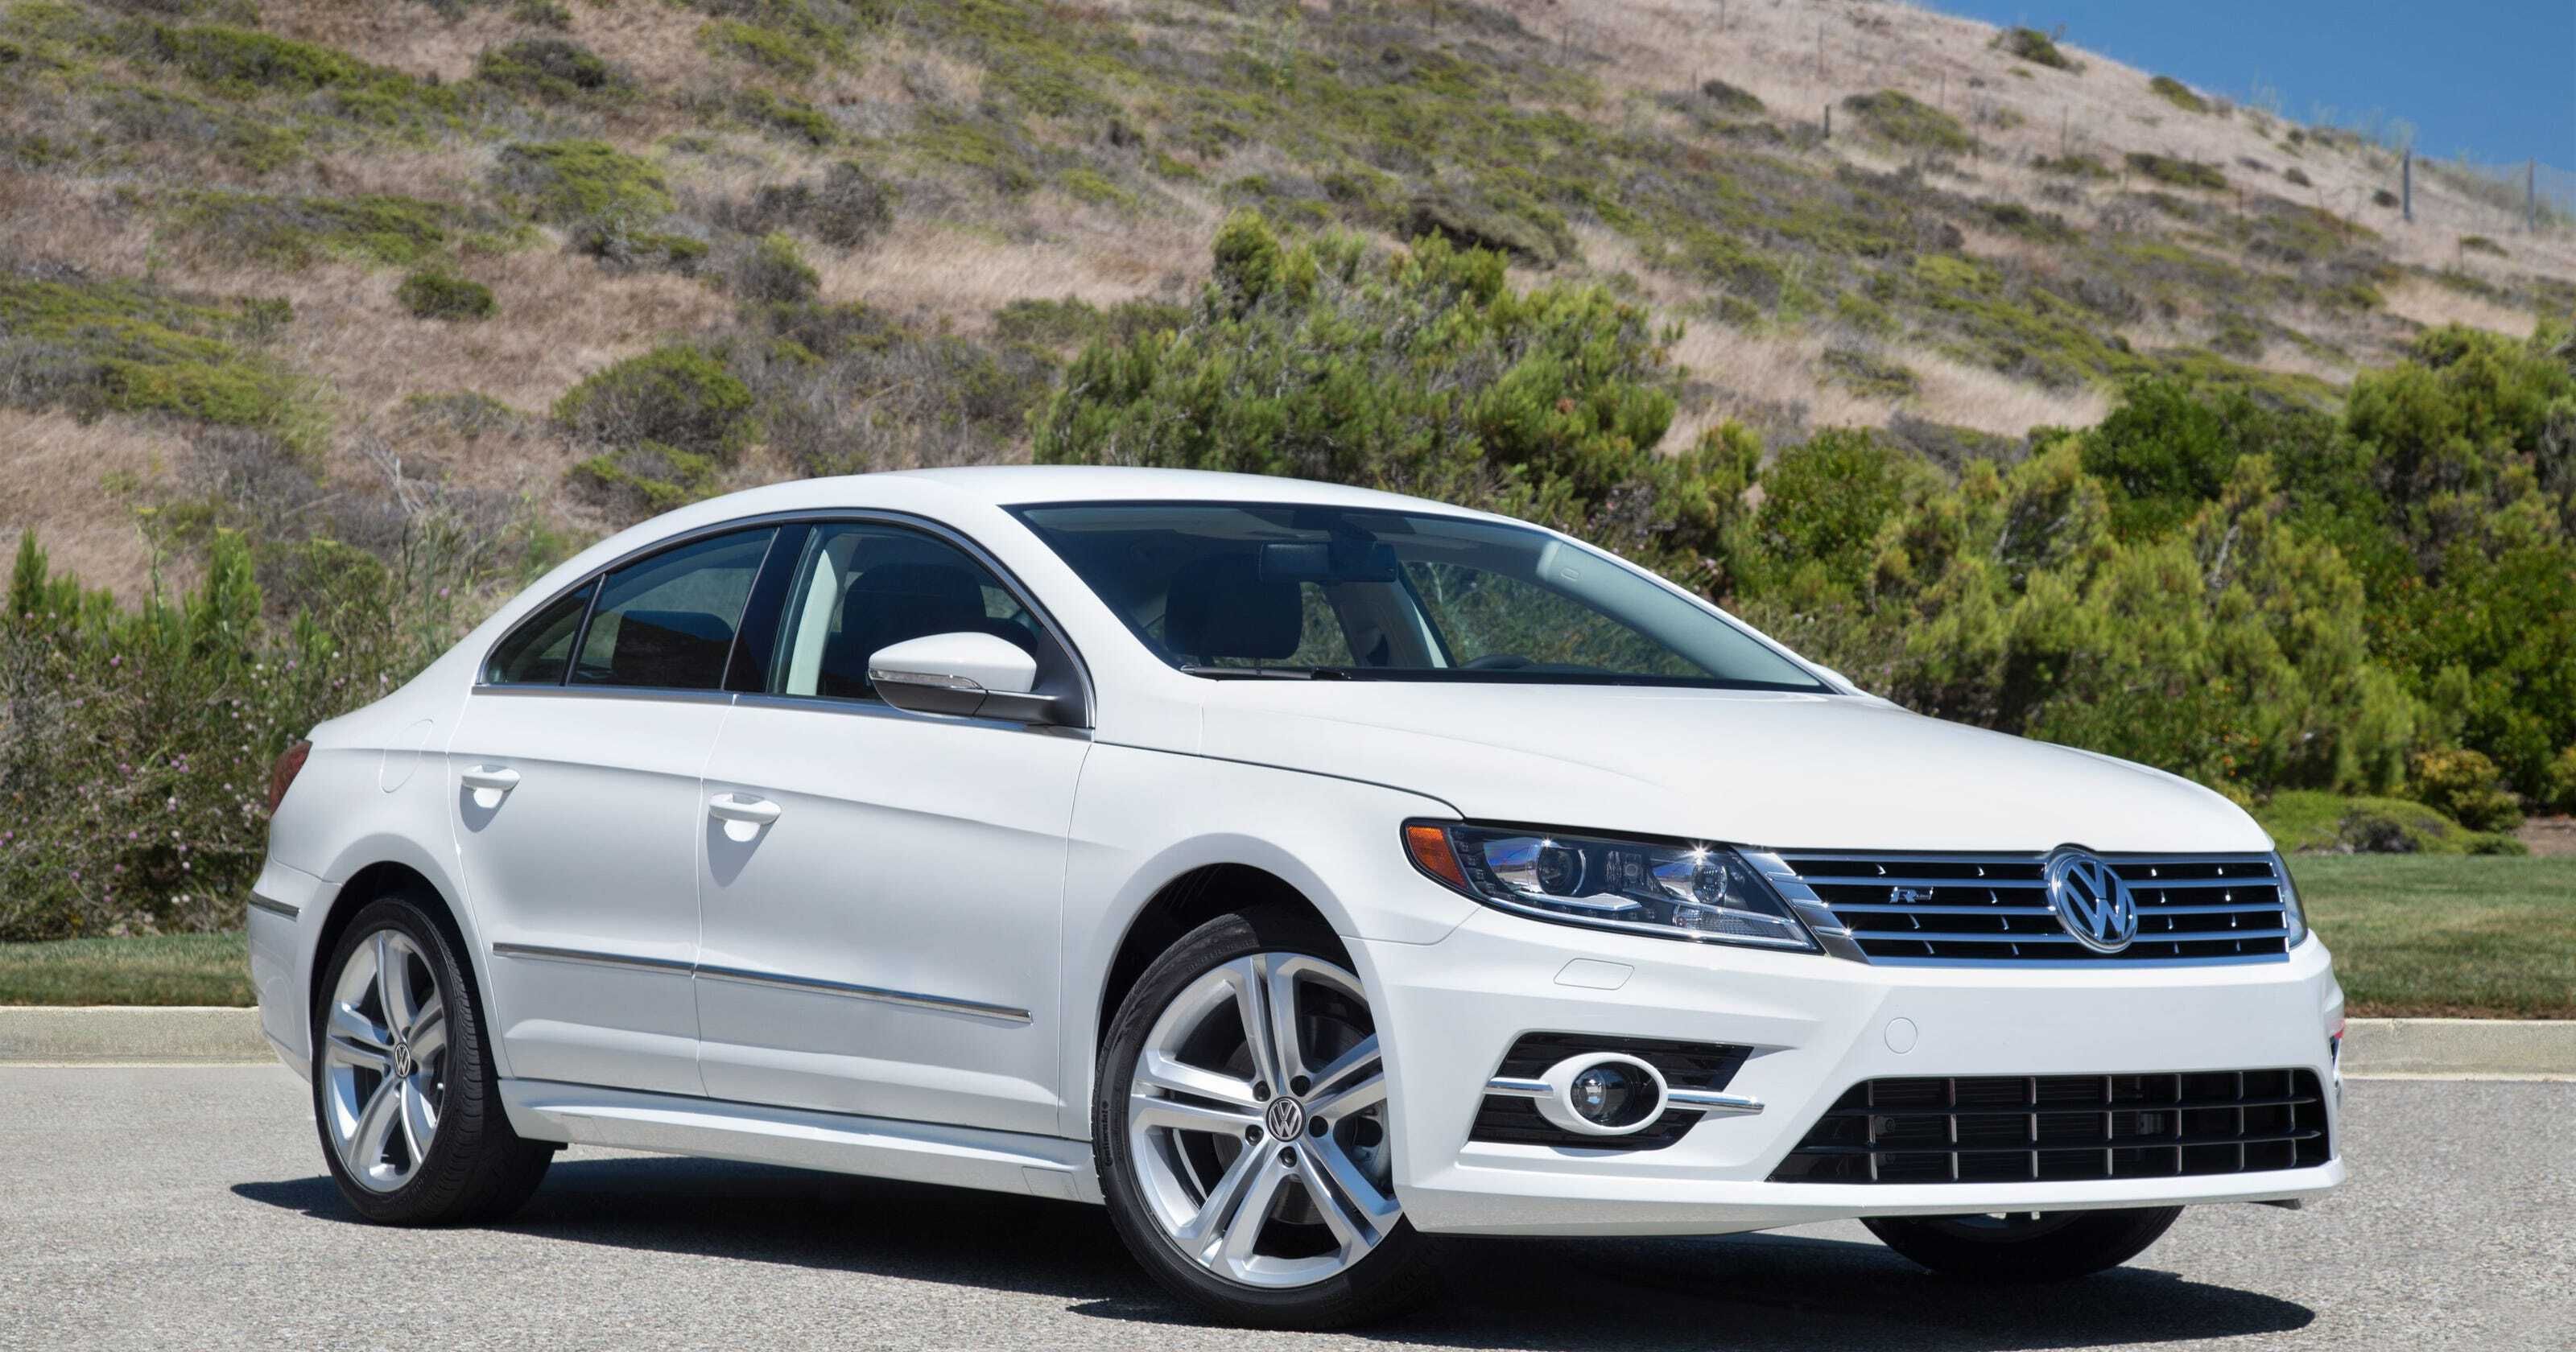
How Much Does the Volkswagen CC Cost?
Pricing for the CC starts at CN¥252,800 Yuan ($35,392 USD) MSRP and goes up to CN¥309,800 Yuan ($43,372 USD) fully equipped.
Volkswagen CC Engine and Performance
CC includes a 2.0TL engine. This delivers 137 Kw (183.72 HP) - 162 Kw (217.25 HP) and 320 Nm (236.80 ft-lb) - 350 Nm (259.00 ft-lb) torque.
Volkswagen CC Specifications
The CC has a curb weight of 1,600 kg (3,500 lbs) - 1,600 kg (3,600 lbs).
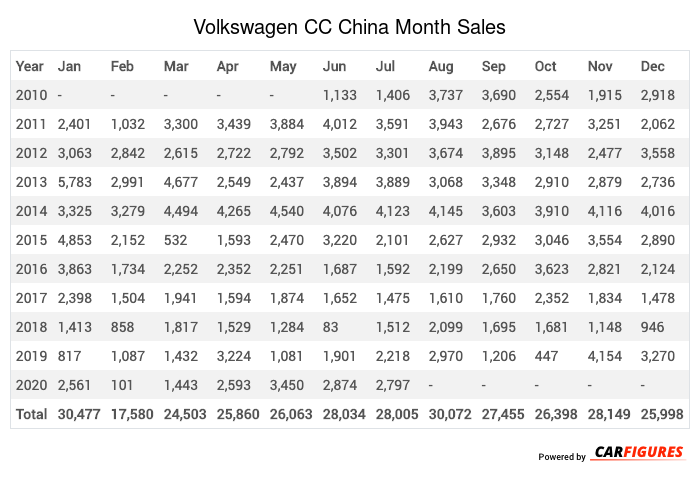
Volkswagen CC China Sale figures by year, quarter, and month are presented below. Including the most up to date sales data for the Volkswagen CC.
Year | Jan | Feb | Mar | Apr | May | Jun | Jul | Aug | Sep | Oct | Nov | Dec |
|---|---|---|---|---|---|---|---|---|---|---|---|---|
| 2010 | - | - | - | - | - | 1,133 | 1,406 | 3,737 | 3,690 | 2,554 | 1,915 | 2,918 |
| 2011 | 2,401 | 1,032 | 3,300 | 3,439 | 3,884 | 4,012 | 3,591 | 3,943 | 2,676 | 2,727 | 3,251 | 2,062 |
| 2012 | 3,063 | 2,842 | 2,615 | 2,722 | 2,792 | 3,502 | 3,301 | 3,674 | 3,895 | 3,148 | 2,477 | 3,558 |
| 2013 | 5,783 | 2,991 | 4,677 | 2,549 | 2,437 | 3,894 | 3,889 | 3,068 | 3,348 | 2,910 | 2,879 | 2,736 |
| 2014 | 3,325 | 3,279 | 4,494 | 4,265 | 4,540 | 4,076 | 4,123 | 4,145 | 3,603 | 3,910 | 4,116 | 4,016 |
| 2015 | 4,853 | 2,152 | 532 | 1,593 | 2,470 | 3,220 | 2,101 | 2,627 | 2,932 | 3,046 | 3,554 | 2,890 |
| 2016 | 3,863 | 1,734 | 2,252 | 2,352 | 2,251 | 1,687 | 1,592 | 2,199 | 2,650 | 3,623 | 2,821 | 2,124 |
| 2017 | 2,398 | 1,504 | 1,941 | 1,594 | 1,874 | 1,652 | 1,475 | 1,610 | 1,760 | 2,352 | 1,834 | 1,478 |
| 2018 | 1,413 | 858 | 1,817 | 1,529 | 1,284 | 83 | 1,512 | 2,099 | 1,695 | 1,681 | 1,148 | 946 |
| 2019 | 817 | 1,087 | 1,432 | 3,224 | 1,081 | 1,901 | 2,218 | 2,970 | 1,206 | 447 | 4,154 | 3,270 |
| 2020 | 2,561 | 101 | 1,443 | 2,593 | 3,450 | 2,874 | 2,797 | - | - | - | - | - |
| Total | 30,477 | 17,580 | 24,503 | 25,860 | 26,063 | 28,034 | 28,005 | 30,072 | 27,455 | 26,398 | 28,149 | 25,998 |
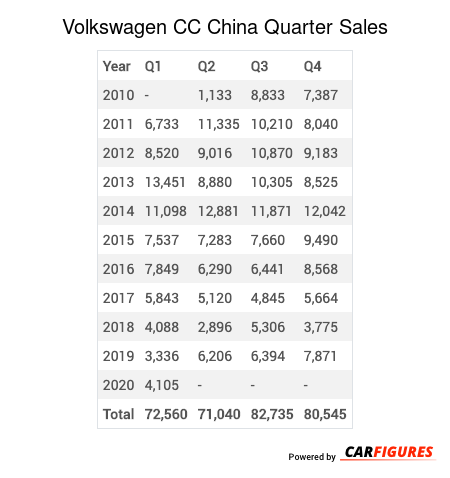
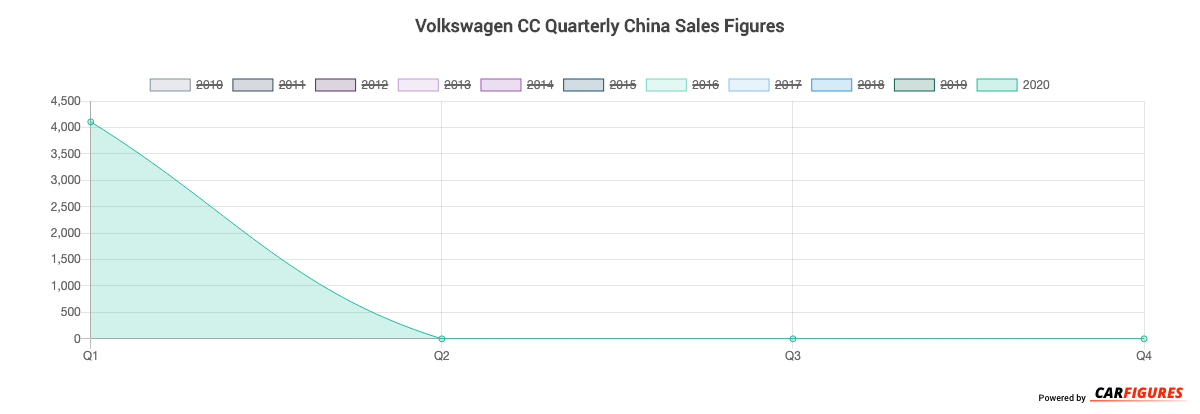
Year | Q1 | Q2 | Q3 | Q4 |
|---|---|---|---|---|
| 2010 | - | 1,133 | 8,833 | 7,387 |
| 2011 | 6,733 | 11,335 | 10,210 | 8,040 |
| 2012 | 8,520 | 9,016 | 10,870 | 9,183 |
| 2013 | 13,451 | 8,880 | 10,305 | 8,525 |
| 2014 | 11,098 | 12,881 | 11,871 | 12,042 |
| 2015 | 7,537 | 7,283 | 7,660 | 9,490 |
| 2016 | 7,849 | 6,290 | 6,441 | 8,568 |
| 2017 | 5,843 | 5,120 | 4,845 | 5,664 |
| 2018 | 4,088 | 2,896 | 5,306 | 3,775 |
| 2019 | 3,336 | 6,206 | 6,394 | 7,871 |
| 2020 | 4,105 | - | - | - |
| Total | 72,560 | 71,040 | 82,735 | 80,545 |
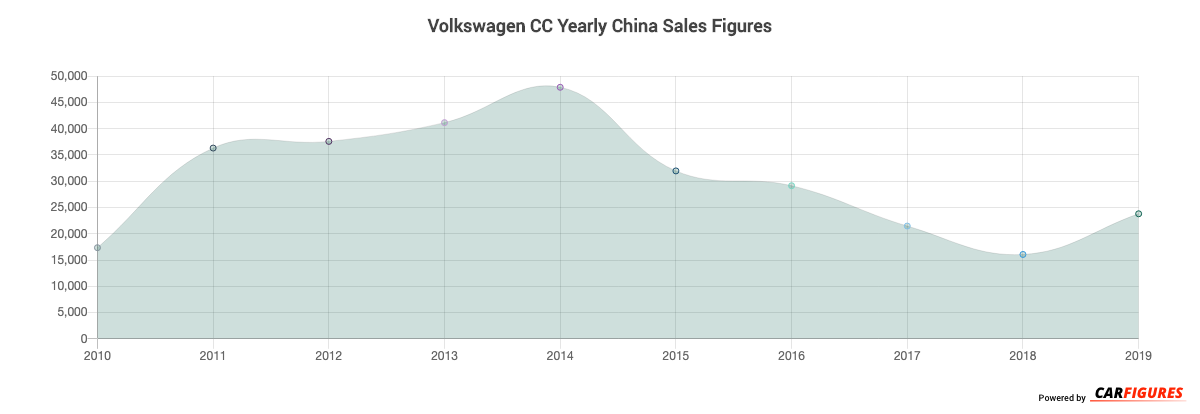
Year | Sales |
|---|---|
| 2020 | 4,105 |
| 2019 | 23,807 |
| 2018 | 16,065 |
| 2017 | 21,472 |
| 2016 | 29,148 |
| 2015 | 31,970 |
| 2014 | 47,892 |
| 2013 | 41,161 |
| 2012 | 37,589 |
| 2011 | 36,318 |
| 2010 | 17,353 |
| Total | 306,880 |
Download Historic Sales Data
Embedded Code
See more widgetsSources: Manufacturers