Key Stats
How many E Class did Mercedes-Benz sell in 2020?
Mercedes-Benz sold 83,403 E Class in 2020. (From Jan - Dec 2020)
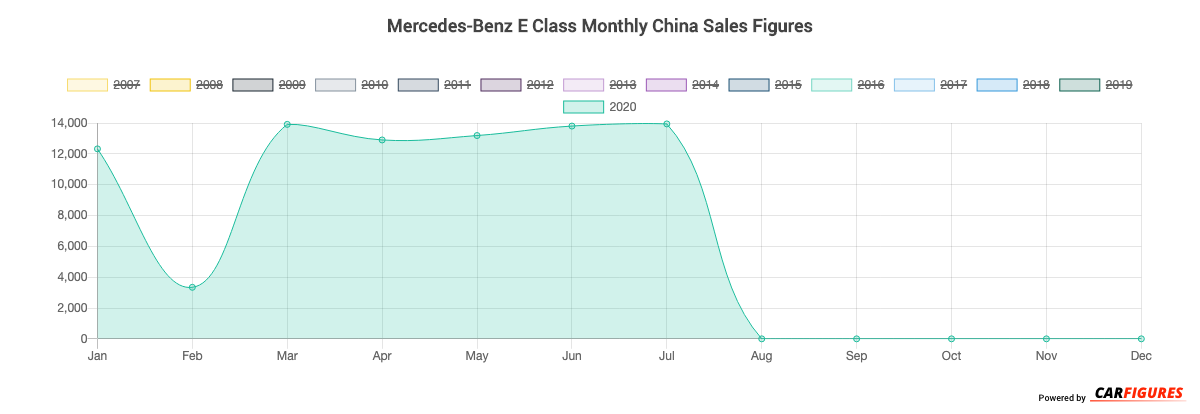
How many E Class did Mercedes-Benz sell in July 2020?
Mercedes-Benz sold 13,940 E Class in July 2020.
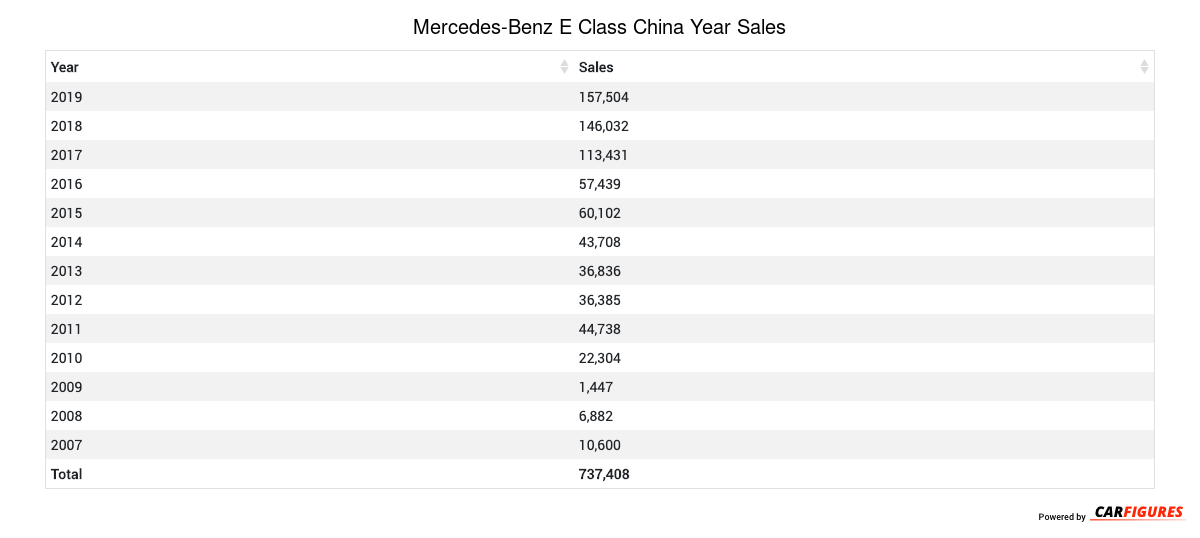
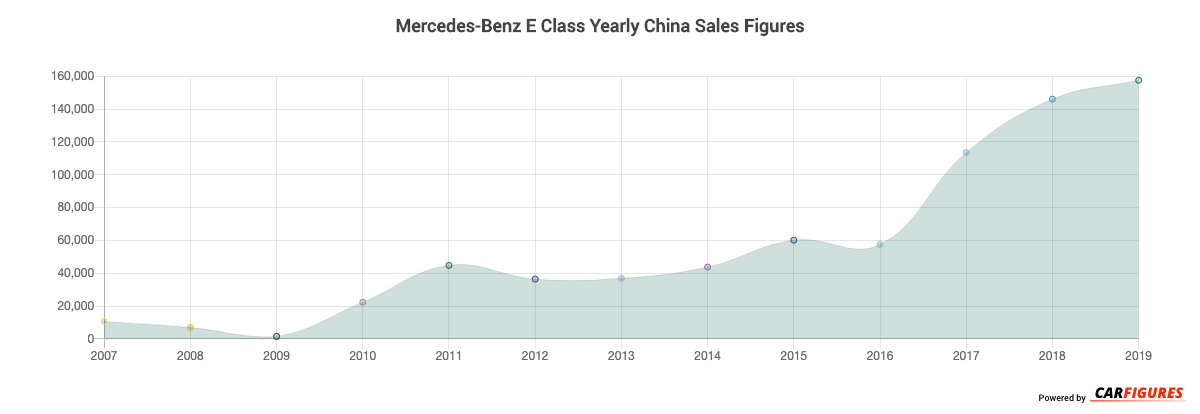
How many E Class did Mercedes-Benz sell in 2019?
Mercedes-Benz sold 157,504 E Class in 2019. In 2018, Mercedes-Benz sold 146,032 E Class. They sold 11,472 more units in 2019 compared to 2018 with a percent gain of 7.86% YoY.
Overview
The E Class is a 4-door 5-seater sedan with room for 5 people.
How Much Does the Mercedes-Benz E Class Cost?
The E Class starts at CN¥435,800 Yuan ($61,012 USD) MSRP. Fully equipped, the E Class will cost you about CN¥629,800 Yuan ($88,172 USD).
Mercedes-Benz E Class Engine and Performance
The E Class includes a 1.5TL that delivers 135 Kw (181.04 HP) - 220 Kw (295.02 HP) and 280 Nm (207.20 ft-lb) - 400 Nm (296.00 ft-lb) torque.
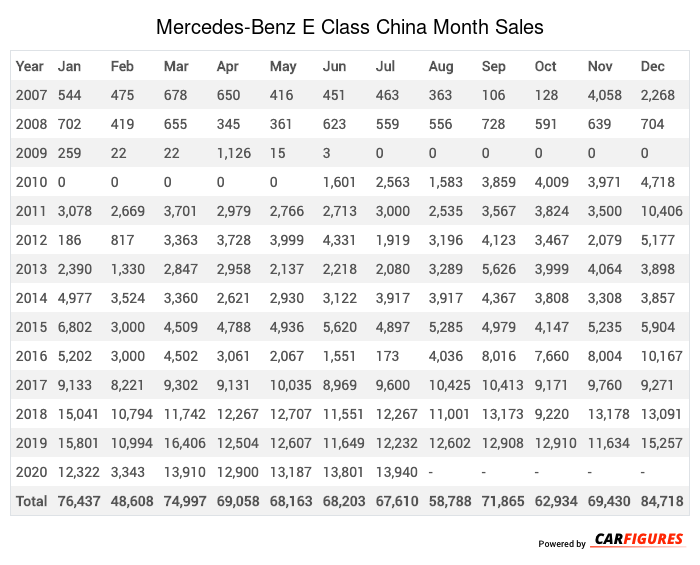
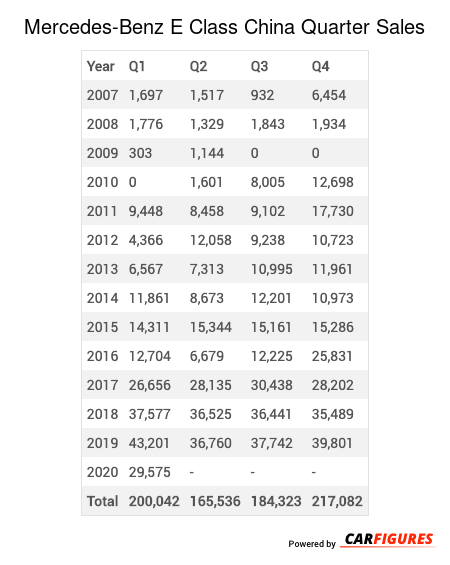
Mercedes-Benz E Class China Sale figures by year, quarter, and month are presented below. Including the most up to date sales data for the Mercedes-Benz E Class.
Year | Jan | Feb | Mar | Apr | May | Jun | Jul | Aug | Sep | Oct | Nov | Dec |
|---|---|---|---|---|---|---|---|---|---|---|---|---|
| 2007 | 544 | 475 | 678 | 650 | 416 | 451 | 463 | 363 | 106 | 128 | 4,058 | 2,268 |
| 2008 | 702 | 419 | 655 | 345 | 361 | 623 | 559 | 556 | 728 | 591 | 639 | 704 |
| 2009 | 259 | 22 | 22 | 1,126 | 15 | 3 | 0 | 0 | 0 | 0 | 0 | 0 |
| 2010 | 0 | 0 | 0 | 0 | 0 | 1,601 | 2,563 | 1,583 | 3,859 | 4,009 | 3,971 | 4,718 |
| 2011 | 3,078 | 2,669 | 3,701 | 2,979 | 2,766 | 2,713 | 3,000 | 2,535 | 3,567 | 3,824 | 3,500 | 10,406 |
| 2012 | 186 | 817 | 3,363 | 3,728 | 3,999 | 4,331 | 1,919 | 3,196 | 4,123 | 3,467 | 2,079 | 5,177 |
| 2013 | 2,390 | 1,330 | 2,847 | 2,958 | 2,137 | 2,218 | 2,080 | 3,289 | 5,626 | 3,999 | 4,064 | 3,898 |
| 2014 | 4,977 | 3,524 | 3,360 | 2,621 | 2,930 | 3,122 | 3,917 | 3,917 | 4,367 | 3,808 | 3,308 | 3,857 |
| 2015 | 6,802 | 3,000 | 4,509 | 4,788 | 4,936 | 5,620 | 4,897 | 5,285 | 4,979 | 4,147 | 5,235 | 5,904 |
| 2016 | 5,202 | 3,000 | 4,502 | 3,061 | 2,067 | 1,551 | 173 | 4,036 | 8,016 | 7,660 | 8,004 | 10,167 |
| 2017 | 9,133 | 8,221 | 9,302 | 9,131 | 10,035 | 8,969 | 9,600 | 10,425 | 10,413 | 9,171 | 9,760 | 9,271 |
| 2018 | 15,041 | 10,794 | 11,742 | 12,267 | 12,707 | 11,551 | 12,267 | 11,001 | 13,173 | 9,220 | 13,178 | 13,091 |
| 2019 | 15,801 | 10,994 | 16,406 | 12,504 | 12,607 | 11,649 | 12,232 | 12,602 | 12,908 | 12,910 | 11,634 | 15,257 |
| 2020 | 12,322 | 3,343 | 13,910 | 12,900 | 13,187 | 13,801 | 13,940 | - | - | - | - | - |
| Total | 76,437 | 48,608 | 74,997 | 69,058 | 68,163 | 68,203 | 67,610 | 58,788 | 71,865 | 62,934 | 69,430 | 84,718 |
Year | Q1 | Q2 | Q3 | Q4 |
|---|---|---|---|---|
| 2007 | 1,697 | 1,517 | 932 | 6,454 |
| 2008 | 1,776 | 1,329 | 1,843 | 1,934 |
| 2009 | 303 | 1,144 | 0 | 0 |
| 2010 | 0 | 1,601 | 8,005 | 12,698 |
| 2011 | 9,448 | 8,458 | 9,102 | 17,730 |
| 2012 | 4,366 | 12,058 | 9,238 | 10,723 |
| 2013 | 6,567 | 7,313 | 10,995 | 11,961 |
| 2014 | 11,861 | 8,673 | 12,201 | 10,973 |
| 2015 | 14,311 | 15,344 | 15,161 | 15,286 |
| 2016 | 12,704 | 6,679 | 12,225 | 25,831 |
| 2017 | 26,656 | 28,135 | 30,438 | 28,202 |
| 2018 | 37,577 | 36,525 | 36,441 | 35,489 |
| 2019 | 43,201 | 36,760 | 37,742 | 39,801 |
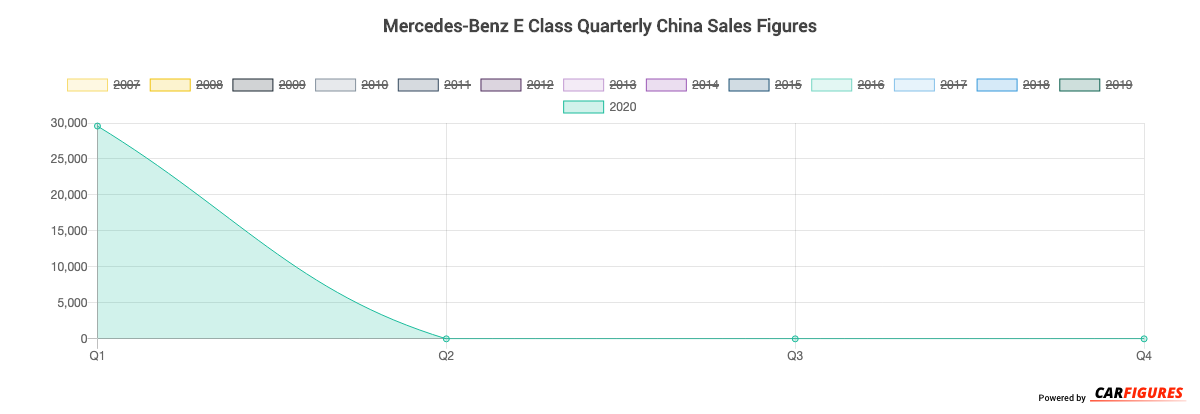
| 2020 | 29,575 | - | - | - |
| Total | 200,042 | 165,536 | 184,323 | 217,082 |
Year | Sales |
|---|---|
| 2020 | 29,575 |
| 2019 | 157,504 |
| 2018 | 146,032 |
| 2017 | 113,431 |
| 2016 | 57,439 |
| 2015 | 60,102 |
| 2014 | 43,708 |
| 2013 | 36,836 |
| 2012 | 36,385 |
| 2011 | 44,738 |
| 2010 | 22,304 |
| 2009 | 1,447 |
| 2008 | 6,882 |
| 2007 | 10,600 |
| Total | 766,983 |
Download Historic Sales Data
Embedded Code
See more widgetsSources: Manufacturers