Key Stats
How many K4 did Kia sell in 2020?
Kia sold 642 K4 in 2020. (From Jan - Dec 2020)
How many K4 did Kia sell in July 2020?
Kia sold 95 K4 in July 2020.
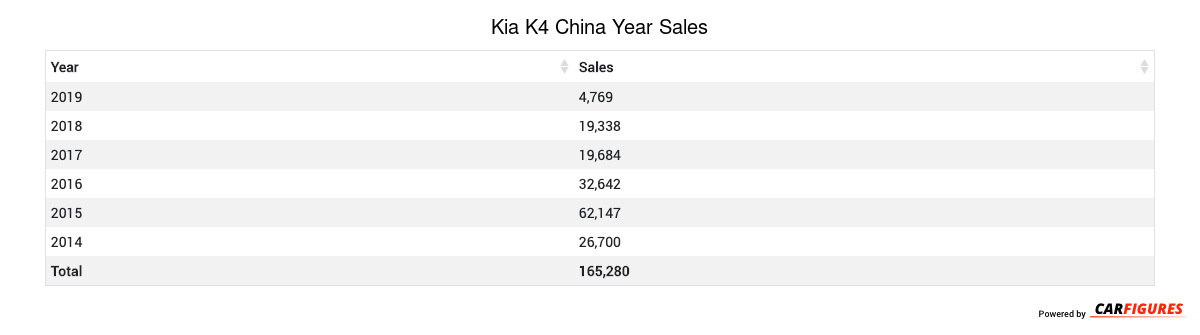
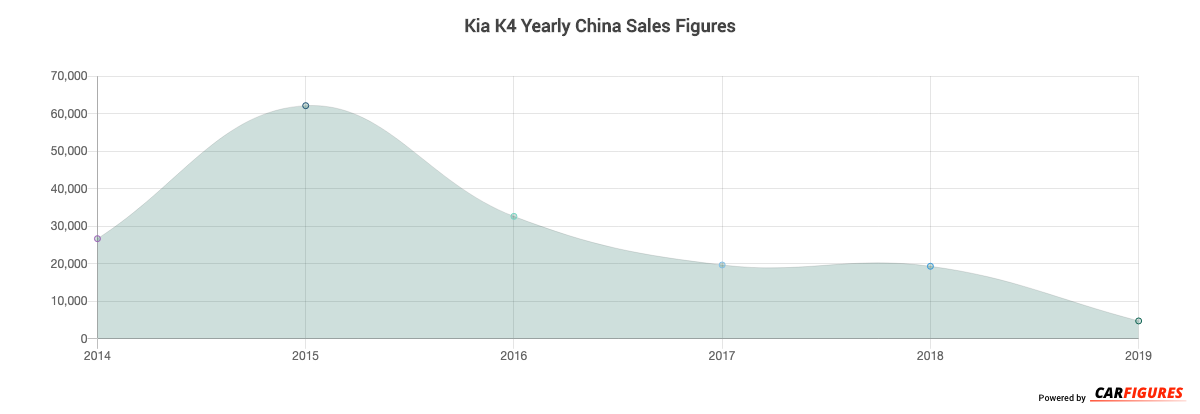
How many K4 did Kia sell in 2019?
Kia sold 4,769 K4 in 2019. In 2018, Kia sold 19,338 K4. They sold 14,569 more units in year 2018 compared to 2019 with a percent loss of 75.34% YoY.
Overview
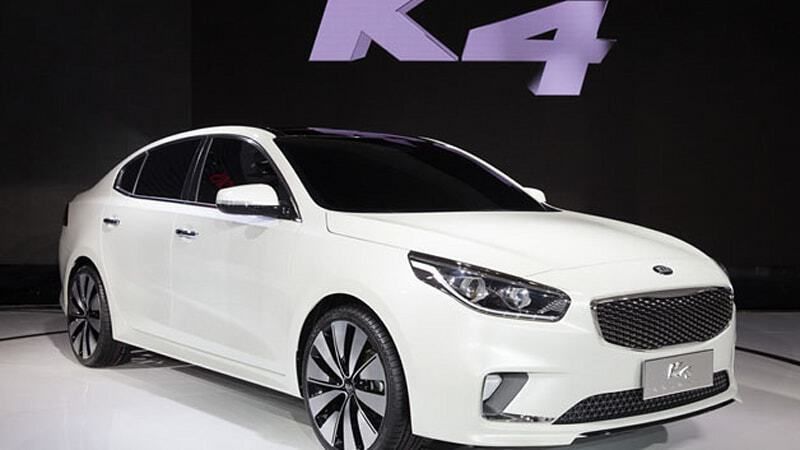
The K4 is a 4-door 5-seater sedan with room for 5 people.
How Much Does the Kia K4 Cost?
The K4 starts at CN¥128,800 Yuan ($18,032 USD) MSRP. Fully equipped, the K4 will cost you about CN¥188,800 Yuan ($26,432 USD).
Kia K4 Engine and Performance
K4 is powered by a 1.8LL engine that makes 105 Kw (140.81 HP) - 129 Kw (172.99 HP) and 176 Nm (130.24 ft-lb) - 265 Nm (196.10 ft-lb) torque.
Kia K4 Specifications
The K4 has a curb weight of 1,400 kg (3,000 lbs) - 1,500 kg (3,300 lbs).
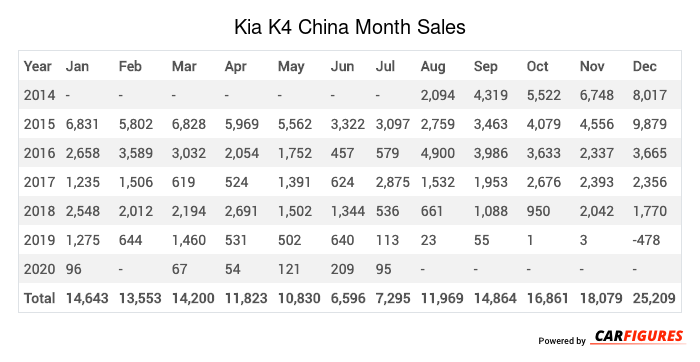
Kia K4 China Sale figures by year, quarter, and month are presented below. Including the most up to date sales data for the Kia K4.
Year | Jan | Feb | Mar | Apr | May | Jun | Jul | Aug | Sep | Oct | Nov | Dec |
|---|---|---|---|---|---|---|---|---|---|---|---|---|
| 2014 | - | - | - | - | - | - | - | 2,094 | 4,319 | 5,522 | 6,748 | 8,017 |
| 2015 | 6,831 | 5,802 | 6,828 | 5,969 | 5,562 | 3,322 | 3,097 | 2,759 | 3,463 | 4,079 | 4,556 | 9,879 |
| 2016 | 2,658 | 3,589 | 3,032 | 2,054 | 1,752 | 457 | 579 | 4,900 | 3,986 | 3,633 | 2,337 | 3,665 |
| 2017 | 1,235 | 1,506 | 619 | 524 | 1,391 | 624 | 2,875 | 1,532 | 1,953 | 2,676 | 2,393 | 2,356 |
| 2018 | 2,548 | 2,012 | 2,194 | 2,691 | 1,502 | 1,344 | 536 | 661 | 1,088 | 950 | 2,042 | 1,770 |
| 2019 | 1,275 | 644 | 1,460 | 531 | 502 | 640 | 113 | 23 | 55 | 1 | 3 | -478 |
| 2020 | 96 | - | 67 | 54 | 121 | 209 | 95 | - | - | - | - | - |
| Total | 14,643 | 13,553 | 14,200 | 11,823 | 10,830 | 6,596 | 7,295 | 11,969 | 14,864 | 16,861 | 18,079 | 25,209 |
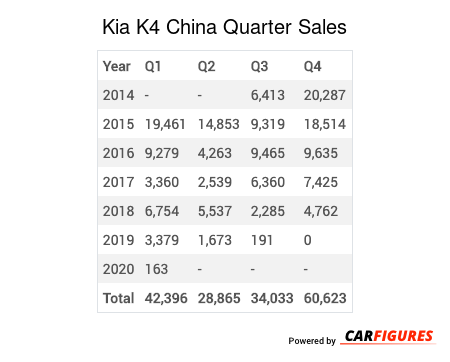
Year | Q1 | Q2 | Q3 | Q4 |
|---|---|---|---|---|
| 2014 | - | - | 6,413 | 20,287 |
| 2015 | 19,461 | 14,853 | 9,319 | 18,514 |
| 2016 | 9,279 | 4,263 | 9,465 | 9,635 |
| 2017 | 3,360 | 2,539 | 6,360 | 7,425 |
| 2018 | 6,754 | 5,537 | 2,285 | 4,762 |
| 2019 | 3,379 | 1,673 | 191 | 0 |
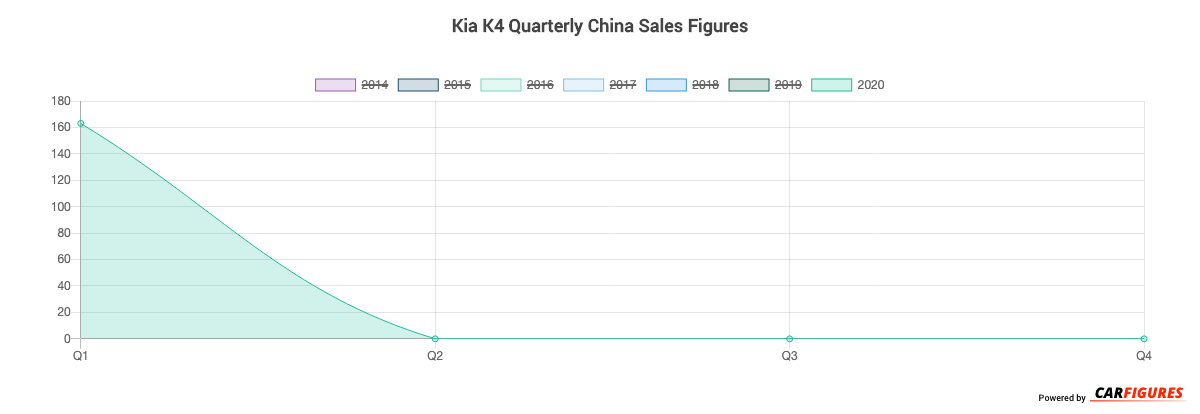
| 2020 | 163 | - | - | - |
| Total | 42,396 | 28,865 | 34,033 | 60,623 |
Year | Sales |
|---|---|
| 2020 | 163 |
| 2019 | 4,769 |
| 2018 | 19,338 |
| 2017 | 19,684 |
| 2016 | 32,642 |
| 2015 | 62,147 |
| 2014 | 26,700 |
| Total | 165,443 |
Download Historic Sales Data

Embedded Code
See more widgetsSources: Manufacturers