Key Stats
How many SL did Kia sell in 2020?
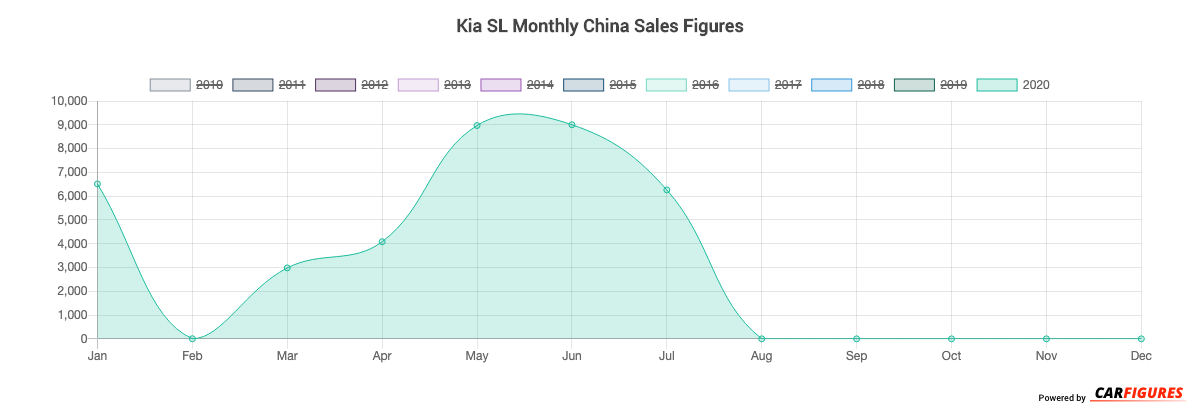
Kia sold 37,815 SL in 2020. (From Jan - Dec 2020)
How many SL did Kia sell in July 2020?
Kia sold 6,261 SL in July 2020.
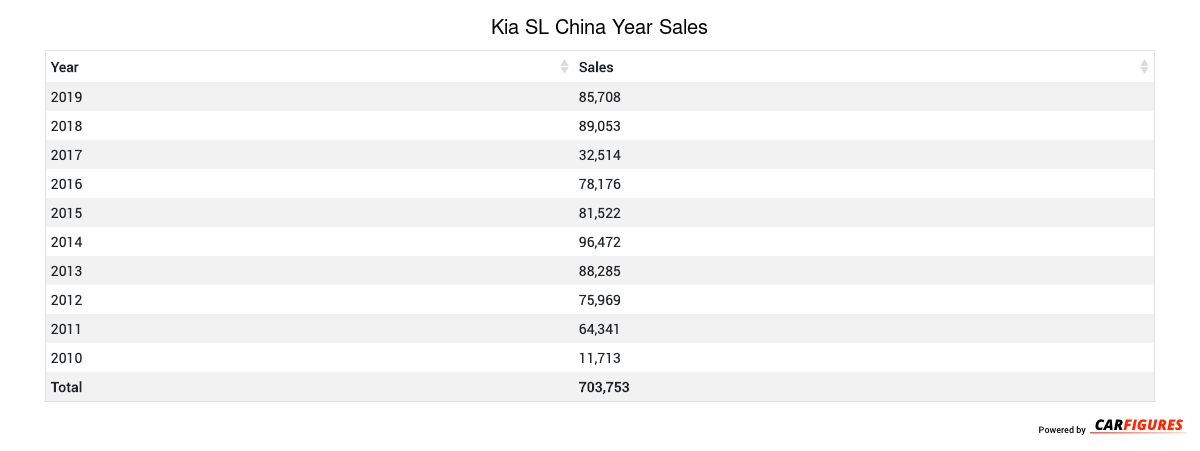
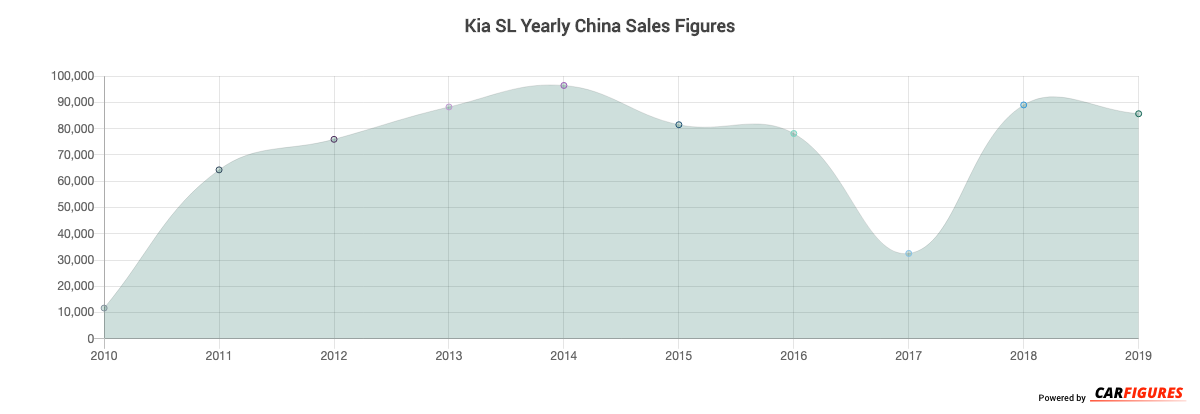
How many SL did Kia sell in 2019?
Kia sold 85,708 SL in 2019. In 2018, Kia sold 89,053 SL. They sold 3,345 more units in year 2018 compared to 2019 with a percent loss of 3.76% YoY.
Overview
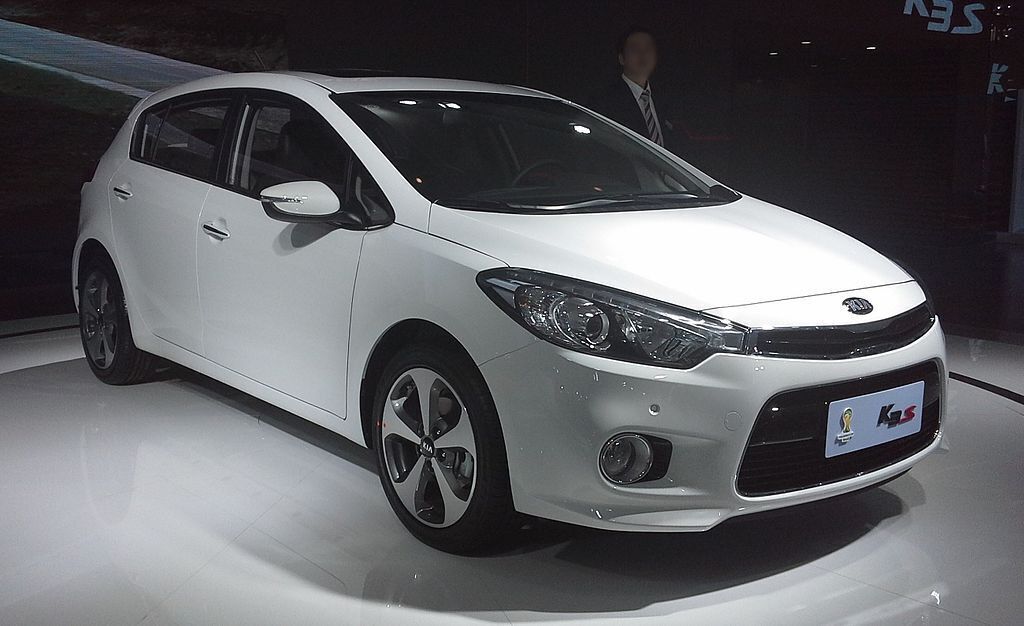
The SL is a vehicle from automaker Kia.
How Much Does the Kia SL Cost?
The SL starts at CN¥119,900 Yuan ($16,786 USD) MSRP. Fully equipped, the SL will cost you about CN¥249,800 Yuan ($34,972 USD).
Kia SL Engine and Performance
SL is powered by a 2.4L engine that makes 103 Kw (138.13 HP) - 128 Kw (171.65 HP) and 193 Nm (142.82 ft-lb) - 242 Nm (179.08 ft-lb) torque.
Kia SL Specifications
The SL has a curb weight of 1,400 kg (3,000 lbs) - 1,500 kg (3,400 lbs).
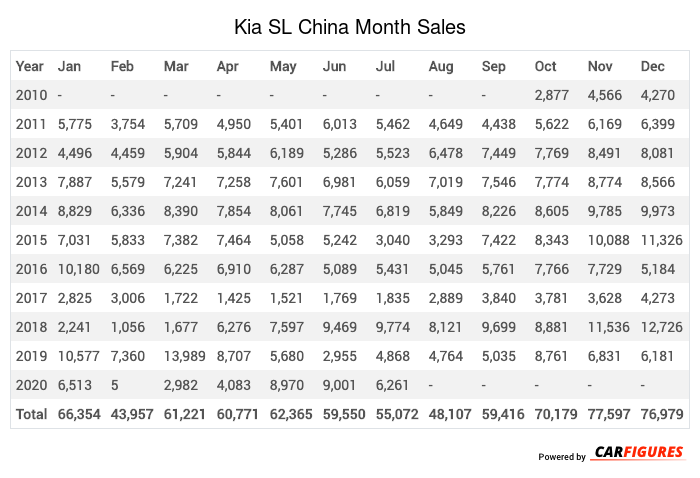
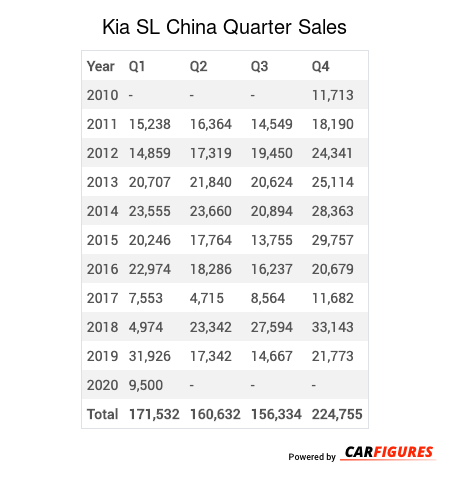
Kia SL China Sale figures by year, quarter, and month are presented below. Including the most up to date sales data for the Kia SL.
Year | Jan | Feb | Mar | Apr | May | Jun | Jul | Aug | Sep | Oct | Nov | Dec |
|---|---|---|---|---|---|---|---|---|---|---|---|---|
| 2010 | - | - | - | - | - | - | - | - | - | 2,877 | 4,566 | 4,270 |
| 2011 | 5,775 | 3,754 | 5,709 | 4,950 | 5,401 | 6,013 | 5,462 | 4,649 | 4,438 | 5,622 | 6,169 | 6,399 |
| 2012 | 4,496 | 4,459 | 5,904 | 5,844 | 6,189 | 5,286 | 5,523 | 6,478 | 7,449 | 7,769 | 8,491 | 8,081 |
| 2013 | 7,887 | 5,579 | 7,241 | 7,258 | 7,601 | 6,981 | 6,059 | 7,019 | 7,546 | 7,774 | 8,774 | 8,566 |
| 2014 | 8,829 | 6,336 | 8,390 | 7,854 | 8,061 | 7,745 | 6,819 | 5,849 | 8,226 | 8,605 | 9,785 | 9,973 |
| 2015 | 7,031 | 5,833 | 7,382 | 7,464 | 5,058 | 5,242 | 3,040 | 3,293 | 7,422 | 8,343 | 10,088 | 11,326 |
| 2016 | 10,180 | 6,569 | 6,225 | 6,910 | 6,287 | 5,089 | 5,431 | 5,045 | 5,761 | 7,766 | 7,729 | 5,184 |
| 2017 | 2,825 | 3,006 | 1,722 | 1,425 | 1,521 | 1,769 | 1,835 | 2,889 | 3,840 | 3,781 | 3,628 | 4,273 |
| 2018 | 2,241 | 1,056 | 1,677 | 6,276 | 7,597 | 9,469 | 9,774 | 8,121 | 9,699 | 8,881 | 11,536 | 12,726 |
| 2019 | 10,577 | 7,360 | 13,989 | 8,707 | 5,680 | 2,955 | 4,868 | 4,764 | 5,035 | 8,761 | 6,831 | 6,181 |
| 2020 | 6,513 | 5 | 2,982 | 4,083 | 8,970 | 9,001 | 6,261 | - | - | - | - | - |
| Total | 66,354 | 43,957 | 61,221 | 60,771 | 62,365 | 59,550 | 55,072 | 48,107 | 59,416 | 70,179 | 77,597 | 76,979 |
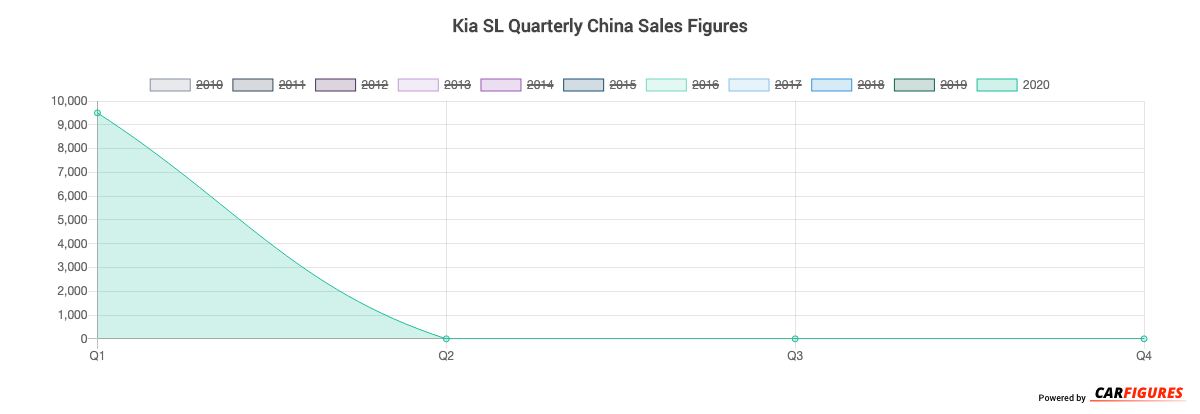
Year | Q1 | Q2 | Q3 | Q4 |
|---|---|---|---|---|
| 2010 | - | - | - | 11,713 |
| 2011 | 15,238 | 16,364 | 14,549 | 18,190 |
| 2012 | 14,859 | 17,319 | 19,450 | 24,341 |
| 2013 | 20,707 | 21,840 | 20,624 | 25,114 |
| 2014 | 23,555 | 23,660 | 20,894 | 28,363 |
| 2015 | 20,246 | 17,764 | 13,755 | 29,757 |
| 2016 | 22,974 | 18,286 | 16,237 | 20,679 |
| 2017 | 7,553 | 4,715 | 8,564 | 11,682 |
| 2018 | 4,974 | 23,342 | 27,594 | 33,143 |
| 2019 | 31,926 | 17,342 | 14,667 | 21,773 |
| 2020 | 9,500 | - | - | - |
| Total | 171,532 | 160,632 | 156,334 | 224,755 |
Year | Sales |
|---|---|
| 2020 | 9,500 |
| 2019 | 85,708 |
| 2018 | 89,053 |
| 2017 | 32,514 |
| 2016 | 78,176 |
| 2015 | 81,522 |
| 2014 | 96,472 |
| 2013 | 88,285 |
| 2012 | 75,969 |
| 2011 | 64,341 |
| 2010 | 11,713 |
| Total | 713,253 |
Download Historic Sales Data
Embedded Code
See more widgetsSources: Manufacturers