Key Stats
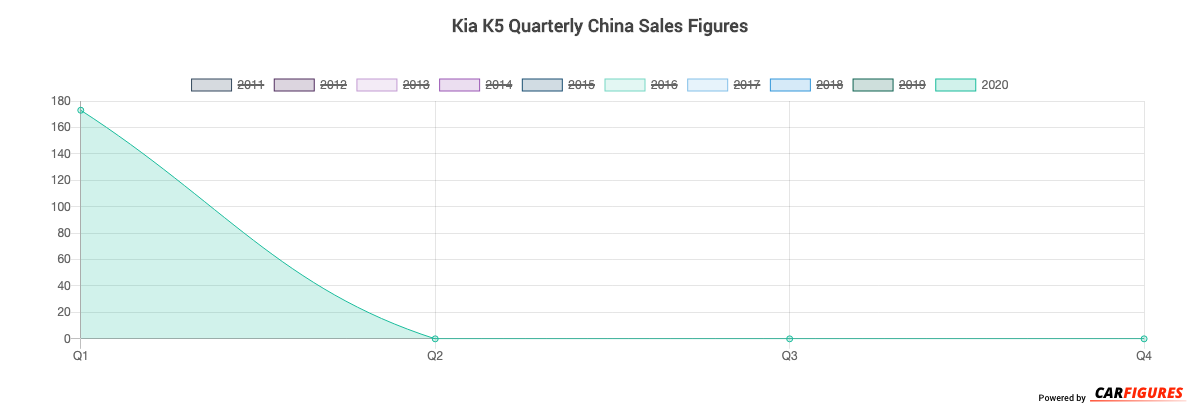
How many K5 did Kia sell in 2020?
Kia sold 1,040 K5 in 2020. (From Jan - Dec 2020)
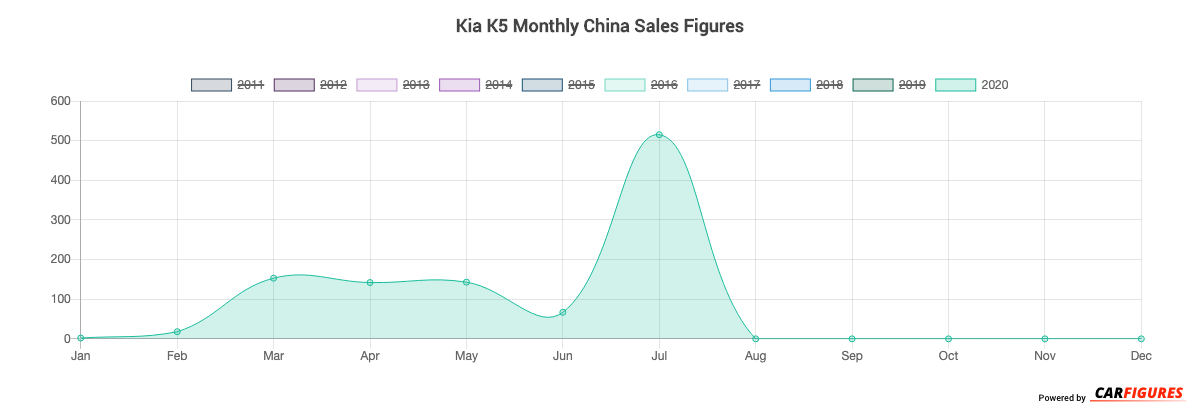
How many K5 did Kia sell in July 2020?
Kia sold 515 K5 in July 2020.
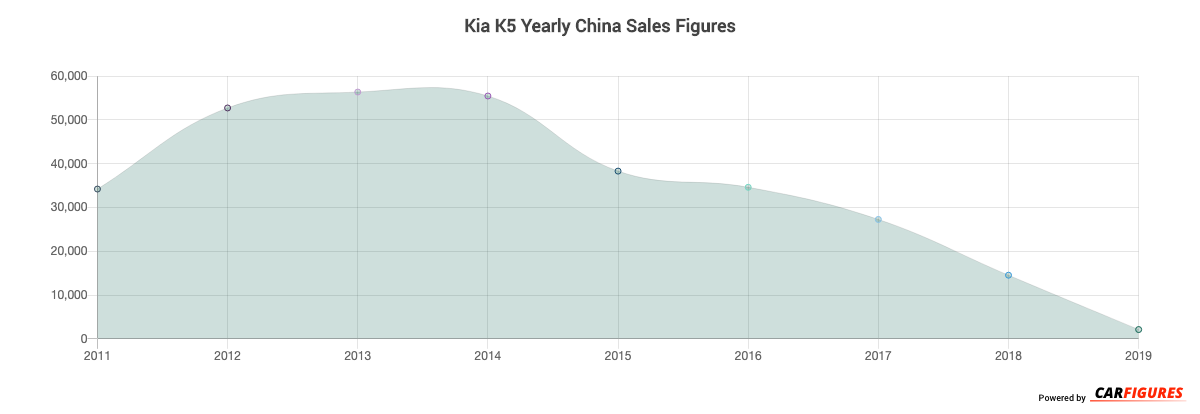
How many K5 did Kia sell in 2019?
Kia sold 2,121 K5 in 2019. In 2018, Kia sold 14,537 K5. They sold 12,416 more units in year 2018 compared to 2019 with a percent loss of 85.41% YoY.
Overview
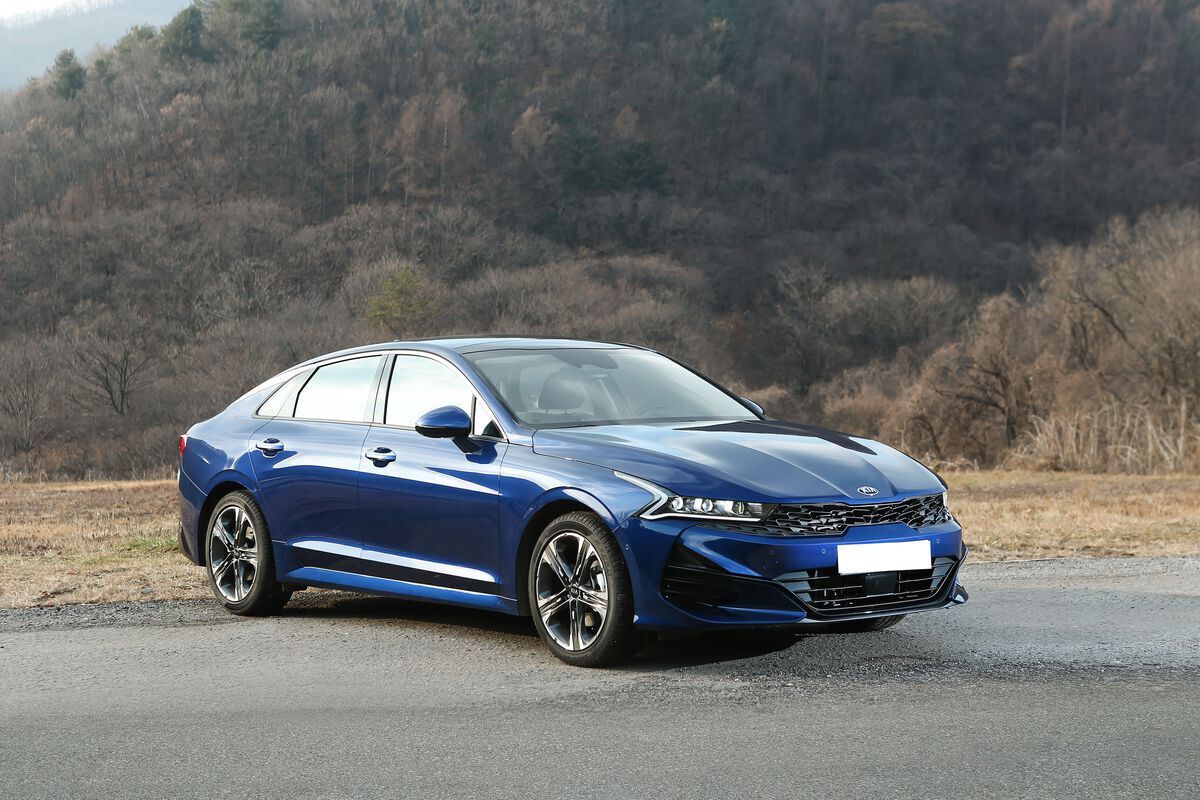
The K5 is a 4-door 5-seater sedan with room for 5 people from automaker Kia.
How Much Does the Kia K5 Cost?
Pricing for the K5 starts at CN¥164,800 Yuan ($23,072 USD) MSRP and goes up to CN¥173,800 Yuan ($24,332 USD) fully equipped.
Kia K5 Engine and Performance
K5 is powered by a 1.6TL engine that makes 118 Kw (158.24 HP) - 132 Kw (177.01 HP) and 193 Nm (142.82 ft-lb) - 265 Nm (196.10 ft-lb) torque.
Kia K5 Specifications
The K5 has a curb weight of 1,500 kg (3,300 lbs) - 1,500 kg (3,400 lbs).
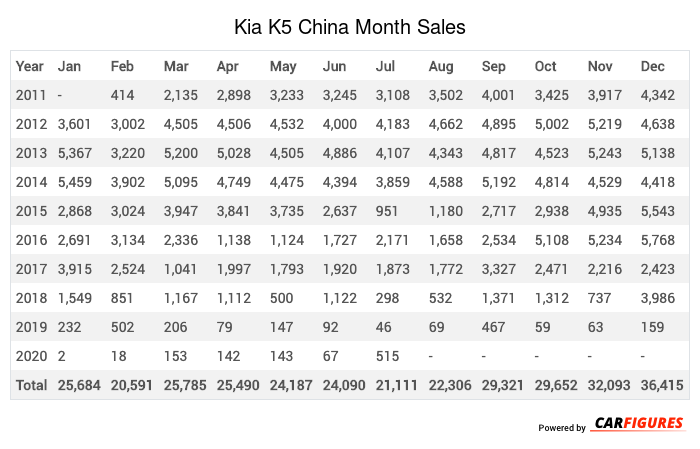
Kia K5 China Sale figures by year, quarter, and month are presented below. Including the most up to date sales data for the Kia K5.
Year | Jan | Feb | Mar | Apr | May | Jun | Jul | Aug | Sep | Oct | Nov | Dec |
|---|---|---|---|---|---|---|---|---|---|---|---|---|
| 2011 | - | 414 | 2,135 | 2,898 | 3,233 | 3,245 | 3,108 | 3,502 | 4,001 | 3,425 | 3,917 | 4,342 |
| 2012 | 3,601 | 3,002 | 4,505 | 4,506 | 4,532 | 4,000 | 4,183 | 4,662 | 4,895 | 5,002 | 5,219 | 4,638 |
| 2013 | 5,367 | 3,220 | 5,200 | 5,028 | 4,505 | 4,886 | 4,107 | 4,343 | 4,817 | 4,523 | 5,243 | 5,138 |
| 2014 | 5,459 | 3,902 | 5,095 | 4,749 | 4,475 | 4,394 | 3,859 | 4,588 | 5,192 | 4,814 | 4,529 | 4,418 |
| 2015 | 2,868 | 3,024 | 3,947 | 3,841 | 3,735 | 2,637 | 951 | 1,180 | 2,717 | 2,938 | 4,935 | 5,543 |
| 2016 | 2,691 | 3,134 | 2,336 | 1,138 | 1,124 | 1,727 | 2,171 | 1,658 | 2,534 | 5,108 | 5,234 | 5,768 |
| 2017 | 3,915 | 2,524 | 1,041 | 1,997 | 1,793 | 1,920 | 1,873 | 1,772 | 3,327 | 2,471 | 2,216 | 2,423 |
| 2018 | 1,549 | 851 | 1,167 | 1,112 | 500 | 1,122 | 298 | 532 | 1,371 | 1,312 | 737 | 3,986 |
| 2019 | 232 | 502 | 206 | 79 | 147 | 92 | 46 | 69 | 467 | 59 | 63 | 159 |
| 2020 | 2 | 18 | 153 | 142 | 143 | 67 | 515 | - | - | - | - | - |
| Total | 25,684 | 20,591 | 25,785 | 25,490 | 24,187 | 24,090 | 21,111 | 22,306 | 29,321 | 29,652 | 32,093 | 36,415 |
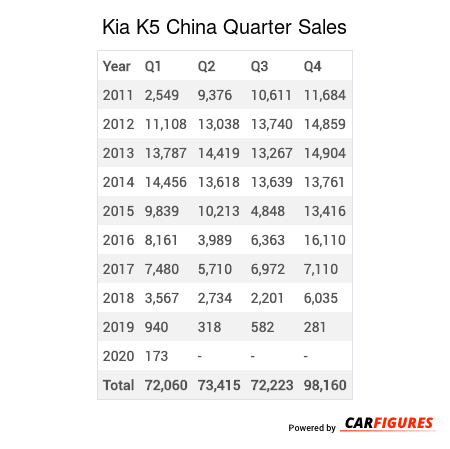
Year | Q1 | Q2 | Q3 | Q4 |
|---|---|---|---|---|
| 2011 | 2,549 | 9,376 | 10,611 | 11,684 |
| 2012 | 11,108 | 13,038 | 13,740 | 14,859 |
| 2013 | 13,787 | 14,419 | 13,267 | 14,904 |
| 2014 | 14,456 | 13,618 | 13,639 | 13,761 |
| 2015 | 9,839 | 10,213 | 4,848 | 13,416 |
| 2016 | 8,161 | 3,989 | 6,363 | 16,110 |
| 2017 | 7,480 | 5,710 | 6,972 | 7,110 |
| 2018 | 3,567 | 2,734 | 2,201 | 6,035 |
| 2019 | 940 | 318 | 582 | 281 |
| 2020 | 173 | - | - | - |
| Total | 72,060 | 73,415 | 72,223 | 98,160 |
Year | Sales |
|---|---|
| 2020 | 173 |
| 2019 | 2,121 |
| 2018 | 14,537 |
| 2017 | 27,272 |
| 2016 | 34,623 |
| 2015 | 38,316 |
| 2014 | 55,474 |
| 2013 | 56,377 |
| 2012 | 52,745 |
| 2011 | 34,220 |
| Total | 315,858 |
Download Historic Sales Data

Embedded Code
See more widgetsSources: Manufacturers