Key Stats
How many Mondeo did Ford sell in 2020?
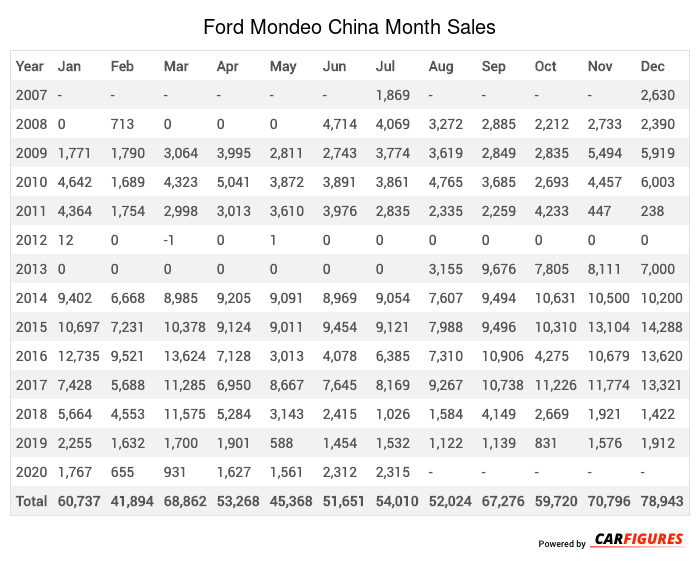
Ford sold 11,168 Mondeo in 2020. (From Jan - Dec 2020)
How many Mondeo did Ford sell in July 2020?
Ford sold 2,315 Mondeo in July 2020.
How many Mondeo did Ford sell in 2019?
Ford sold 17,642 Mondeo in 2019. In 2018, Ford sold 45,405 Mondeo. They sold 27,763 more units in year 2018 compared to 2019 with a percent loss of 61.15% YoY.
Overview
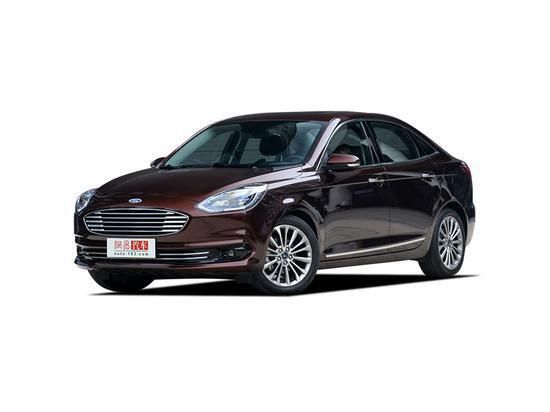
The Mondeo is a 4-door 5-seater sedan with room for 5 people from automaker Ford.
How Much Does the Ford Mondeo Cost?
Pricing for the Mondeo starts at CN¥192,800 Yuan ($26,992 USD) MSRP and goes up to CN¥279,800 Yuan ($39,172 USD) fully equipped.
Ford Mondeo Engine and Performance
Mondeo includes a 1.5TL engine. This delivers 133 Kw (178.36 HP) - 180 Kw (241.38 HP) and 240 Nm (177.60 ft-lb) - 350 Nm (259.00 ft-lb) torque.
Ford Mondeo Specifications
The Mondeo has a curb weight of 1,600 kg (3,400 lbs) - 1,700 kg (3,700 lbs).
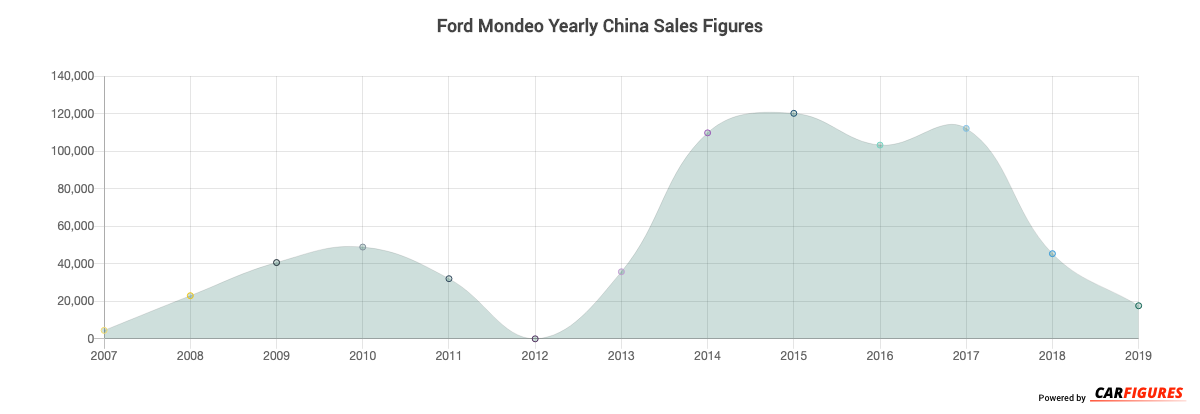
Ford Mondeo China Sale figures by year, quarter, and month are presented below. Including the most up to date sales data for the Ford Mondeo.
Year | Jan | Feb | Mar | Apr | May | Jun | Jul | Aug | Sep | Oct | Nov | Dec |
|---|---|---|---|---|---|---|---|---|---|---|---|---|
| 2007 | - | - | - | - | - | - | 1,869 | - | - | - | - | 2,630 |
| 2008 | 0 | 713 | 0 | 0 | 0 | 4,714 | 4,069 | 3,272 | 2,885 | 2,212 | 2,733 | 2,390 |
| 2009 | 1,771 | 1,790 | 3,064 | 3,995 | 2,811 | 2,743 | 3,774 | 3,619 | 2,849 | 2,835 | 5,494 | 5,919 |
| 2010 | 4,642 | 1,689 | 4,323 | 5,041 | 3,872 | 3,891 | 3,861 | 4,765 | 3,685 | 2,693 | 4,457 | 6,003 |
| 2011 | 4,364 | 1,754 | 2,998 | 3,013 | 3,610 | 3,976 | 2,835 | 2,335 | 2,259 | 4,233 | 447 | 238 |
| 2012 | 12 | 0 | -1 | 0 | 1 | 0 | 0 | 0 | 0 | 0 | 0 | 0 |
| 2013 | 0 | 0 | 0 | 0 | 0 | 0 | 0 | 3,155 | 9,676 | 7,805 | 8,111 | 7,000 |
| 2014 | 9,402 | 6,668 | 8,985 | 9,205 | 9,091 | 8,969 | 9,054 | 7,607 | 9,494 | 10,631 | 10,500 | 10,200 |
| 2015 | 10,697 | 7,231 | 10,378 | 9,124 | 9,011 | 9,454 | 9,121 | 7,988 | 9,496 | 10,310 | 13,104 | 14,288 |
| 2016 | 12,735 | 9,521 | 13,624 | 7,128 | 3,013 | 4,078 | 6,385 | 7,310 | 10,906 | 4,275 | 10,679 | 13,620 |
| 2017 | 7,428 | 5,688 | 11,285 | 6,950 | 8,667 | 7,645 | 8,169 | 9,267 | 10,738 | 11,226 | 11,774 | 13,321 |
| 2018 | 5,664 | 4,553 | 11,575 | 5,284 | 3,143 | 2,415 | 1,026 | 1,584 | 4,149 | 2,669 | 1,921 | 1,422 |
| 2019 | 2,255 | 1,632 | 1,700 | 1,901 | 588 | 1,454 | 1,532 | 1,122 | 1,139 | 831 | 1,576 | 1,912 |
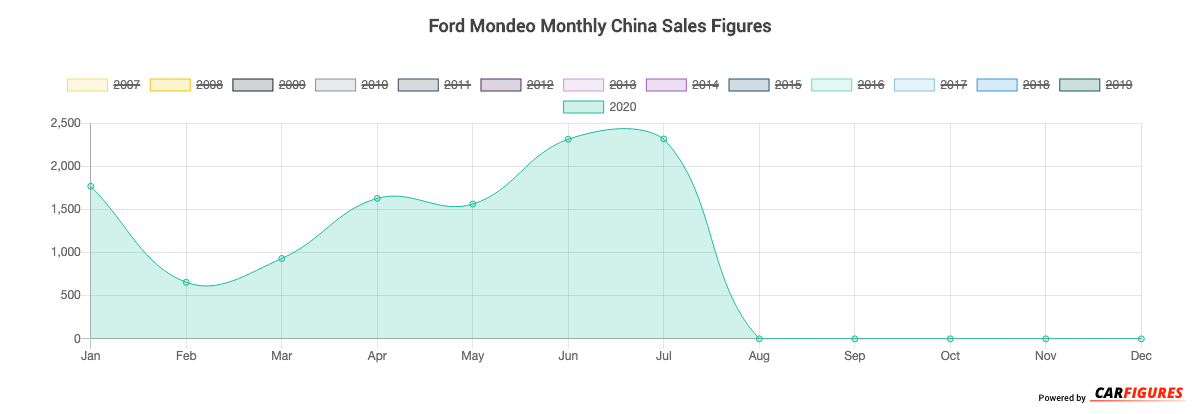
| 2020 | 1,767 | 655 | 931 | 1,627 | 1,561 | 2,312 | 2,315 | - | - | - | - | - |
| Total | 60,737 | 41,894 | 68,862 | 53,268 | 45,368 | 51,651 | 54,010 | 52,024 | 67,276 | 59,720 | 70,796 | 78,943 |
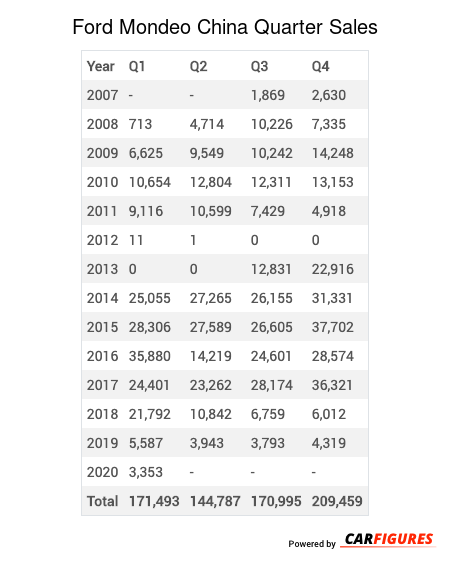
Year | Q1 | Q2 | Q3 | Q4 |
|---|---|---|---|---|
| 2007 | - | - | 1,869 | 2,630 |
| 2008 | 713 | 4,714 | 10,226 | 7,335 |
| 2009 | 6,625 | 9,549 | 10,242 | 14,248 |
| 2010 | 10,654 | 12,804 | 12,311 | 13,153 |
| 2011 | 9,116 | 10,599 | 7,429 | 4,918 |
| 2012 | 11 | 1 | 0 | 0 |
| 2013 | 0 | 0 | 12,831 | 22,916 |
| 2014 | 25,055 | 27,265 | 26,155 | 31,331 |
| 2015 | 28,306 | 27,589 | 26,605 | 37,702 |
| 2016 | 35,880 | 14,219 | 24,601 | 28,574 |
| 2017 | 24,401 | 23,262 | 28,174 | 36,321 |
| 2018 | 21,792 | 10,842 | 6,759 | 6,012 |
| 2019 | 5,587 | 3,943 | 3,793 | 4,319 |
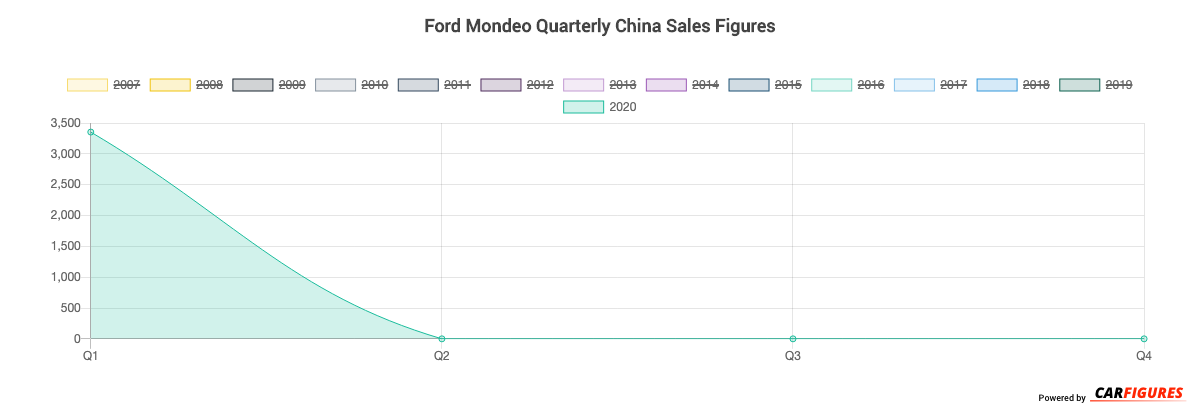
| 2020 | 3,353 | - | - | - |
| Total | 171,493 | 144,787 | 170,995 | 209,459 |
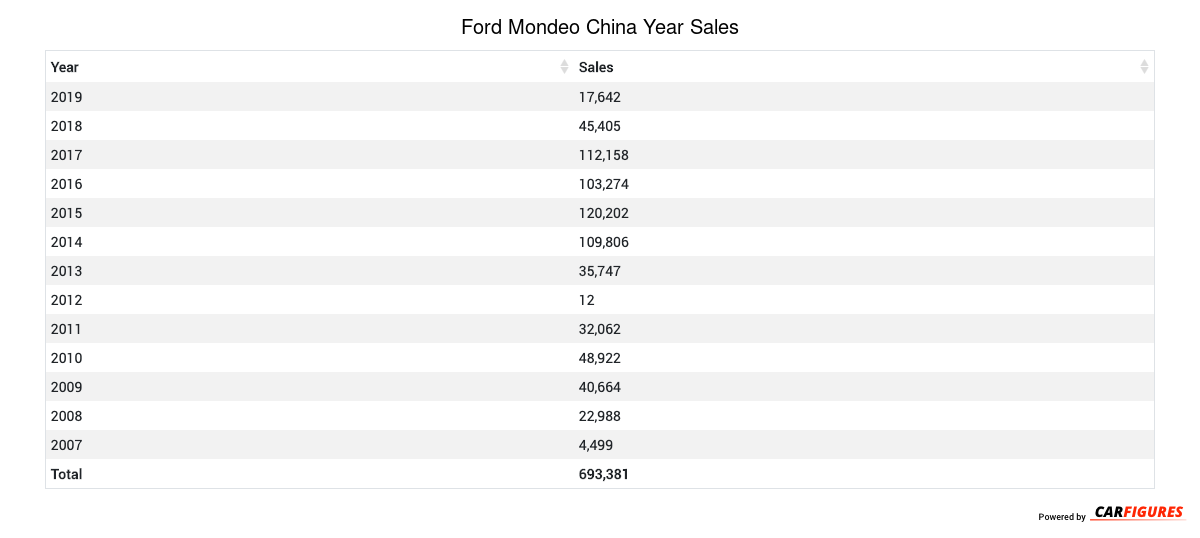
Year | Sales |
|---|---|
| 2020 | 3,353 |
| 2019 | 17,642 |
| 2018 | 45,405 |
| 2017 | 112,158 |
| 2016 | 103,274 |
| 2015 | 120,202 |
| 2014 | 109,806 |
| 2013 | 35,747 |
| 2012 | 12 |
| 2011 | 32,062 |
| 2010 | 48,922 |
| 2009 | 40,664 |
| 2008 | 22,988 |
| 2007 | 4,499 |
| Total | 696,734 |
Download Historic Sales Data
Embedded Code
See more widgetsSources: Manufacturers