
Key Stats
How many Edge did Ford sell in 2020?
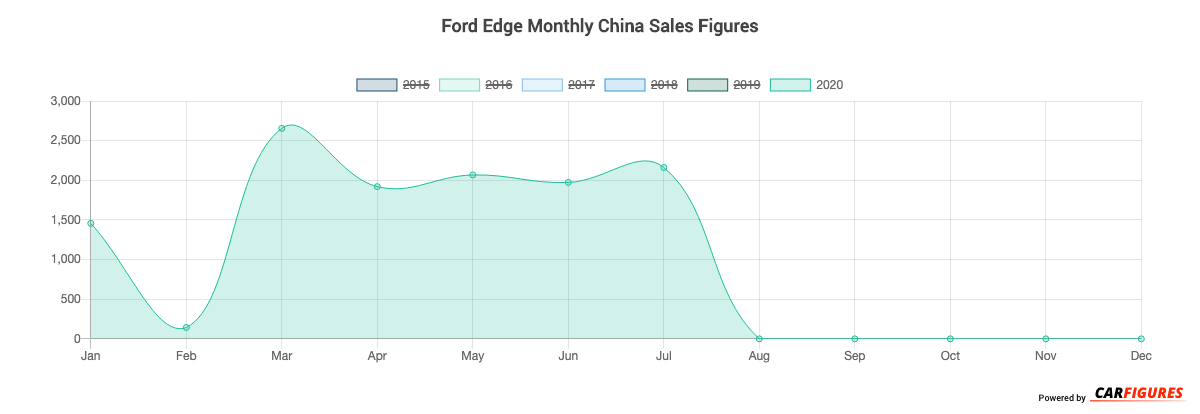
Ford sold 12,376 Edge in 2020. (From Jan - Dec 2020)
How many Edge did Ford sell in July 2020?
Ford sold 2,161 Edge in July 2020.
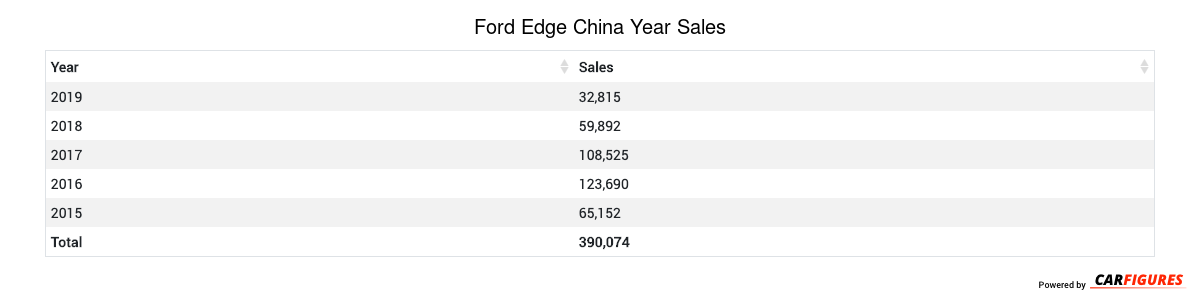
How many Edge did Ford sell in 2019?
Ford sold 32,815 Edge in 2019. In 2018, Ford sold 59,892 Edge. They sold 27,077 more units in year 2018 compared to 2019 with a percent loss of 45.21% YoY.
Overview
The Edge is a 5 doors 5 seats SUV with room for 5 people.
How Much Does the Ford Edge Cost?
The Edge starts at CN¥229,800 Yuan ($32,172 USD) MSRP. Fully equipped, the Edge will cost you about CN¥429,800 Yuan ($60,172 USD).
Ford Edge Engine and Performance
Edge is powered by a 2.0TL engine that makes 180 Kw (241.38 HP) - 242 Kw (324.53 HP) and 350 Nm (259.00 ft-lb) - 475 Nm (351.50 ft-lb) torque.
Ford Edge Specifications
The Edge has a curb weight of 1,800 kg (4,100 lbs) - 2,200 kg (4,700 lbs).
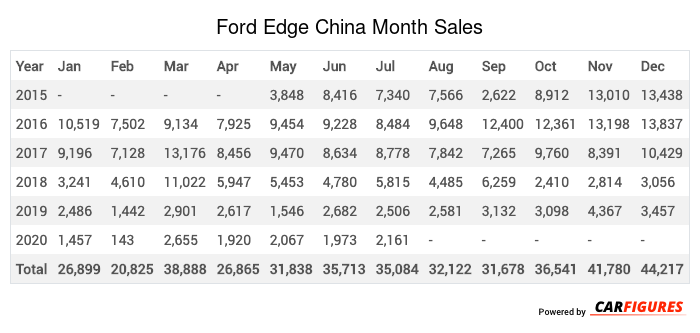
Ford Edge China Sale figures by year, quarter, and month are presented below. Including the most up to date sales data for the Ford Edge.
Year | Jan | Feb | Mar | Apr | May | Jun | Jul | Aug | Sep | Oct | Nov | Dec |
|---|---|---|---|---|---|---|---|---|---|---|---|---|
| 2015 | - | - | - | - | 3,848 | 8,416 | 7,340 | 7,566 | 2,622 | 8,912 | 13,010 | 13,438 |
| 2016 | 10,519 | 7,502 | 9,134 | 7,925 | 9,454 | 9,228 | 8,484 | 9,648 | 12,400 | 12,361 | 13,198 | 13,837 |
| 2017 | 9,196 | 7,128 | 13,176 | 8,456 | 9,470 | 8,634 | 8,778 | 7,842 | 7,265 | 9,760 | 8,391 | 10,429 |
| 2018 | 3,241 | 4,610 | 11,022 | 5,947 | 5,453 | 4,780 | 5,815 | 4,485 | 6,259 | 2,410 | 2,814 | 3,056 |
| 2019 | 2,486 | 1,442 | 2,901 | 2,617 | 1,546 | 2,682 | 2,506 | 2,581 | 3,132 | 3,098 | 4,367 | 3,457 |
| 2020 | 1,457 | 143 | 2,655 | 1,920 | 2,067 | 1,973 | 2,161 | - | - | - | - | - |
| Total | 26,899 | 20,825 | 38,888 | 26,865 | 31,838 | 35,713 | 35,084 | 32,122 | 31,678 | 36,541 | 41,780 | 44,217 |
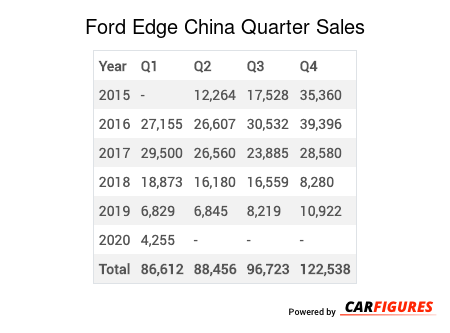
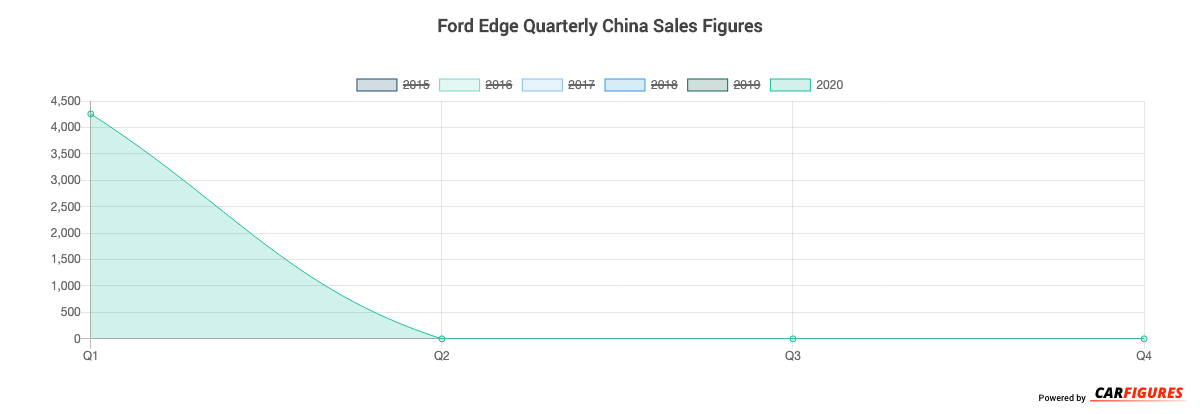
Year | Q1 | Q2 | Q3 | Q4 |
|---|---|---|---|---|
| 2015 | - | 12,264 | 17,528 | 35,360 |
| 2016 | 27,155 | 26,607 | 30,532 | 39,396 |
| 2017 | 29,500 | 26,560 | 23,885 | 28,580 |
| 2018 | 18,873 | 16,180 | 16,559 | 8,280 |
| 2019 | 6,829 | 6,845 | 8,219 | 10,922 |
| 2020 | 4,255 | - | - | - |
| Total | 86,612 | 88,456 | 96,723 | 122,538 |
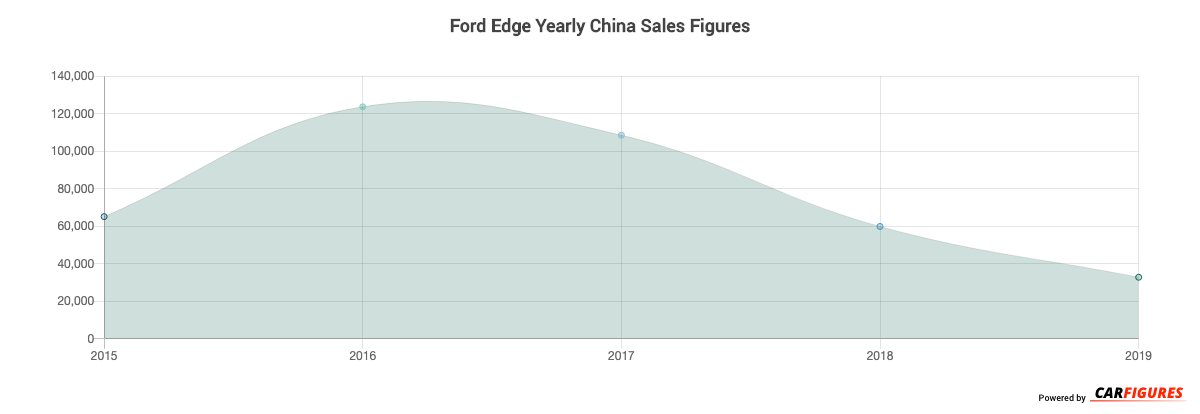
Year | Sales |
|---|---|
| 2020 | 4,255 |
| 2019 | 32,815 |
| 2018 | 59,892 |
| 2017 | 108,525 |
| 2016 | 123,690 |
| 2015 | 65,152 |
| Total | 394,329 |
Download Historic Sales Data
Embedded Code
See more widgetsSources: Manufacturers