Key Stats
How many Escort did Ford sell in 2020?
Ford sold 20,048 Escort in 2020. (From Jan - Dec 2020)
How many Escort did Ford sell in July 2020?
Ford sold 1,740 Escort in July 2020.
How many Escort did Ford sell in 2019?
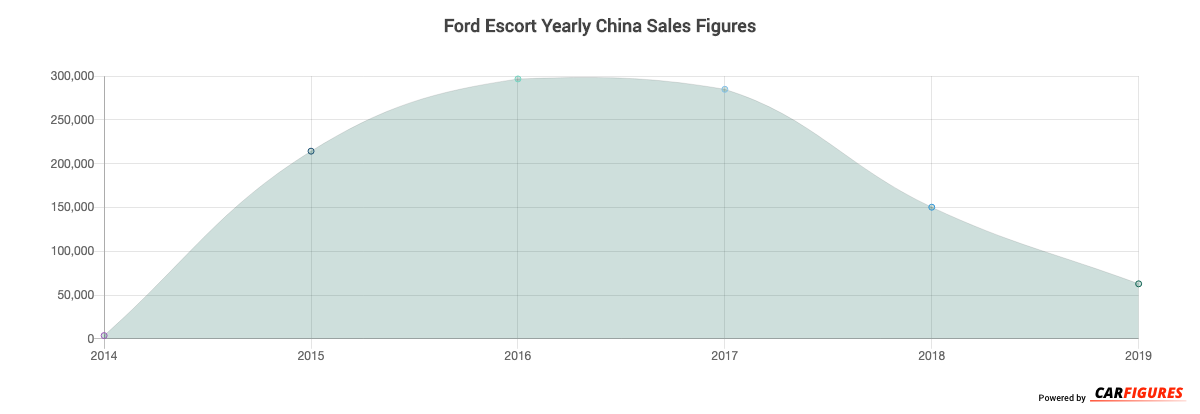
Ford sold 62,842 Escort in 2019. In 2018, Ford sold 150,360 Escort. They sold 87,518 more units in year 2018 compared to 2019 with a percent loss of 58.21% YoY.
Overview
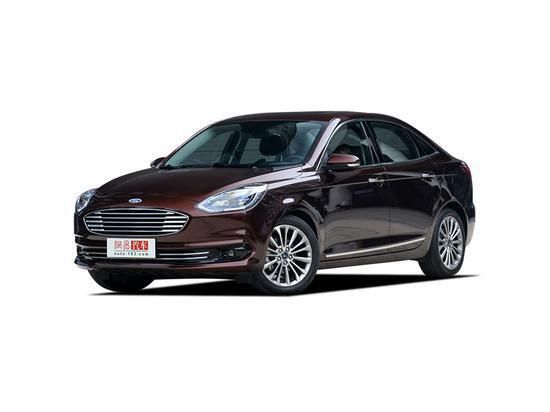
The Escort is a 4-door 5-seater sedan with room for 5 people.
How Much Does the Ford Escort Cost?
The Escort starts at CN¥79,800 Yuan ($11,172 USD) MSRP. Fully equipped, the Escort will cost you about CN¥119,800 Yuan ($16,772 USD).
Ford Escort Engine and Performance
Escort is powered by a 1.5LL engine that makes 90 Kw (120.69 HP) - 94 Kw (126.06 HP) and 150 Nm (111.00 ft-lb) - 170 Nm (125.80 ft-lb) torque.
Ford Escort Specifications
The Escort has a curb weight of 1,300 kg (2,800 lbs) - 1,400 kg (3,000 lbs).
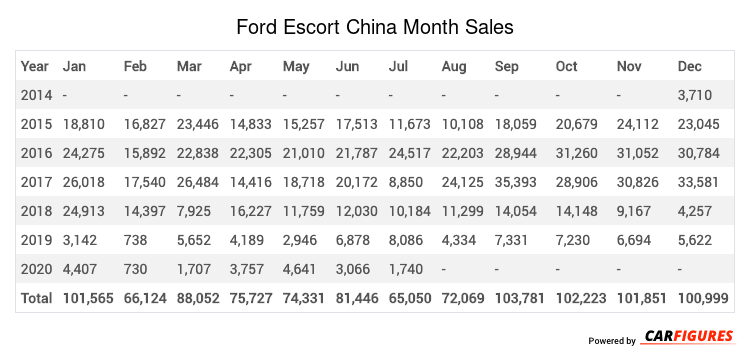
Ford Escort China Sale figures by year, quarter, and month are presented below. Including the most up to date sales data for the Ford Escort.
Year | Jan | Feb | Mar | Apr | May | Jun | Jul | Aug | Sep | Oct | Nov | Dec |
|---|---|---|---|---|---|---|---|---|---|---|---|---|
| 2014 | - | - | - | - | - | - | - | - | - | - | - | 3,710 |
| 2015 | 18,810 | 16,827 | 23,446 | 14,833 | 15,257 | 17,513 | 11,673 | 10,108 | 18,059 | 20,679 | 24,112 | 23,045 |
| 2016 | 24,275 | 15,892 | 22,838 | 22,305 | 21,010 | 21,787 | 24,517 | 22,203 | 28,944 | 31,260 | 31,052 | 30,784 |
| 2017 | 26,018 | 17,540 | 26,484 | 14,416 | 18,718 | 20,172 | 8,850 | 24,125 | 35,393 | 28,906 | 30,826 | 33,581 |
| 2018 | 24,913 | 14,397 | 7,925 | 16,227 | 11,759 | 12,030 | 10,184 | 11,299 | 14,054 | 14,148 | 9,167 | 4,257 |
| 2019 | 3,142 | 738 | 5,652 | 4,189 | 2,946 | 6,878 | 8,086 | 4,334 | 7,331 | 7,230 | 6,694 | 5,622 |
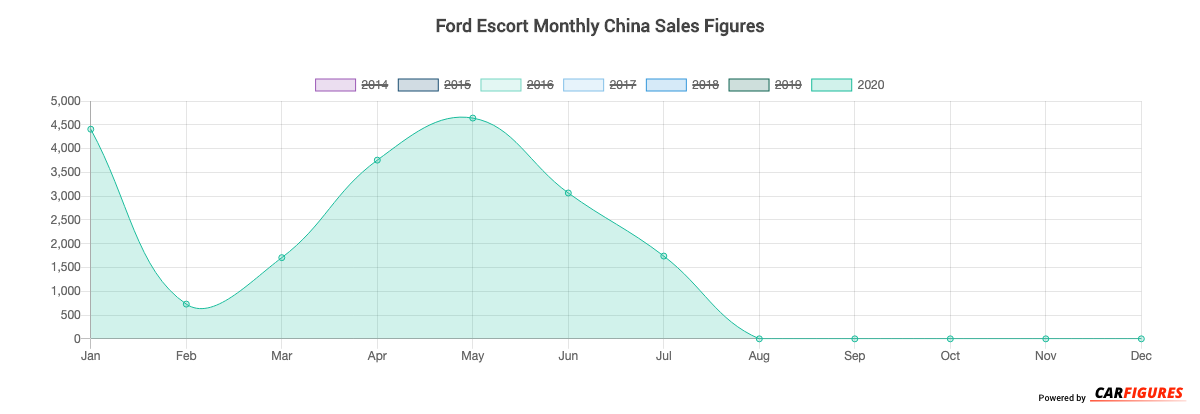
| 2020 | 4,407 | 730 | 1,707 | 3,757 | 4,641 | 3,066 | 1,740 | - | - | - | - | - |
| Total | 101,565 | 66,124 | 88,052 | 75,727 | 74,331 | 81,446 | 65,050 | 72,069 | 103,781 | 102,223 | 101,851 | 100,999 |
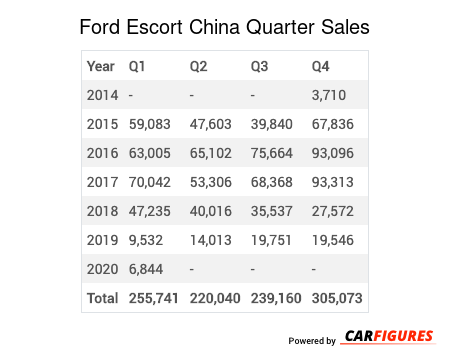
Year | Q1 | Q2 | Q3 | Q4 |
|---|---|---|---|---|
| 2014 | - | - | - | 3,710 |
| 2015 | 59,083 | 47,603 | 39,840 | 67,836 |
| 2016 | 63,005 | 65,102 | 75,664 | 93,096 |
| 2017 | 70,042 | 53,306 | 68,368 | 93,313 |
| 2018 | 47,235 | 40,016 | 35,537 | 27,572 |
| 2019 | 9,532 | 14,013 | 19,751 | 19,546 |
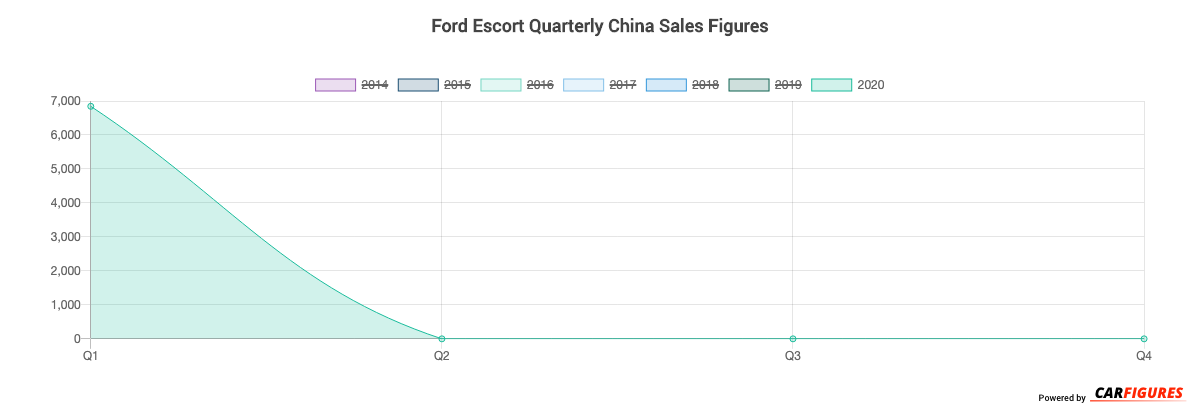
| 2020 | 6,844 | - | - | - |
| Total | 255,741 | 220,040 | 239,160 | 305,073 |
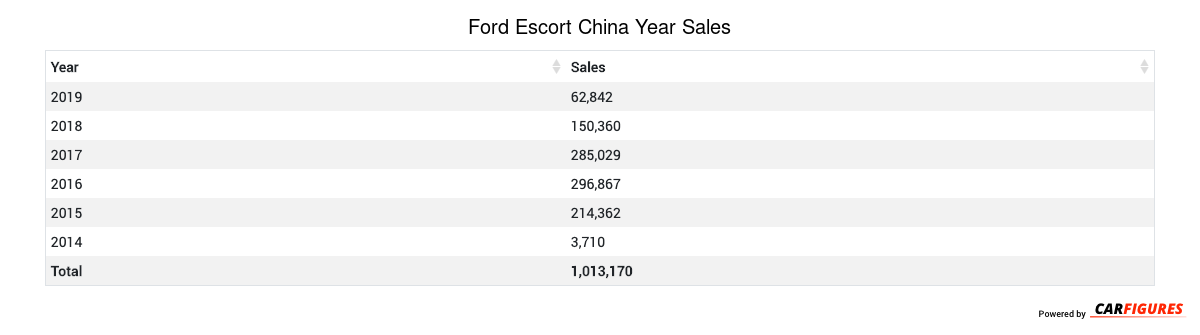
Year | Sales |
|---|---|
| 2020 | 6,844 |
| 2019 | 62,842 |
| 2018 | 150,360 |
| 2017 | 285,029 |
| 2016 | 296,867 |
| 2015 | 214,362 |
| 2014 | 3,710 |
| Total | 1,020,014 |
Download Historic Sales Data
Embedded Code
See more widgetsSources: Manufacturers