Key Stats
How many Kuga did Ford sell in 2020?
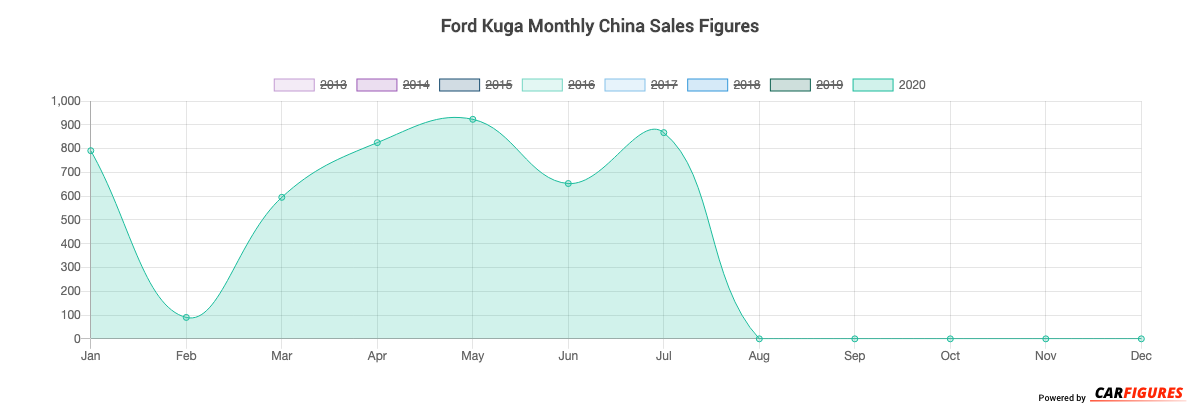
Ford sold 4,744 Kuga in 2020. (From Jan - Dec 2020)
How many Kuga did Ford sell in July 2020?
Ford sold 867 Kuga in July 2020.
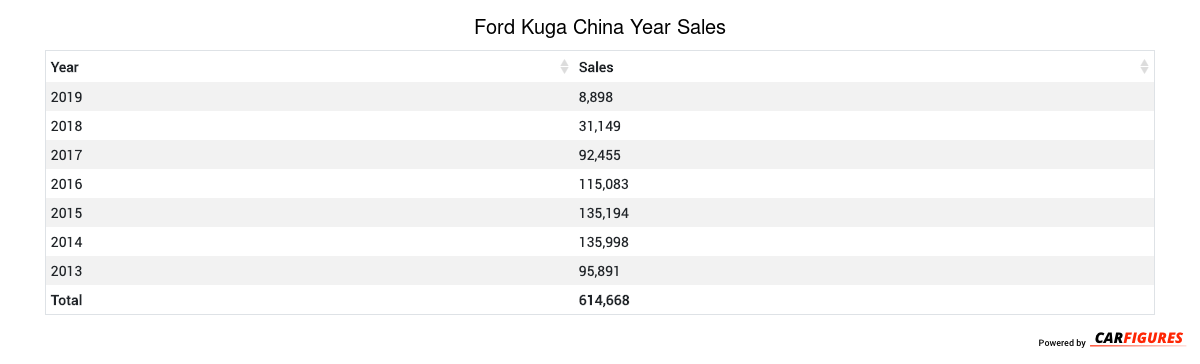
How many Kuga did Ford sell in 2019?
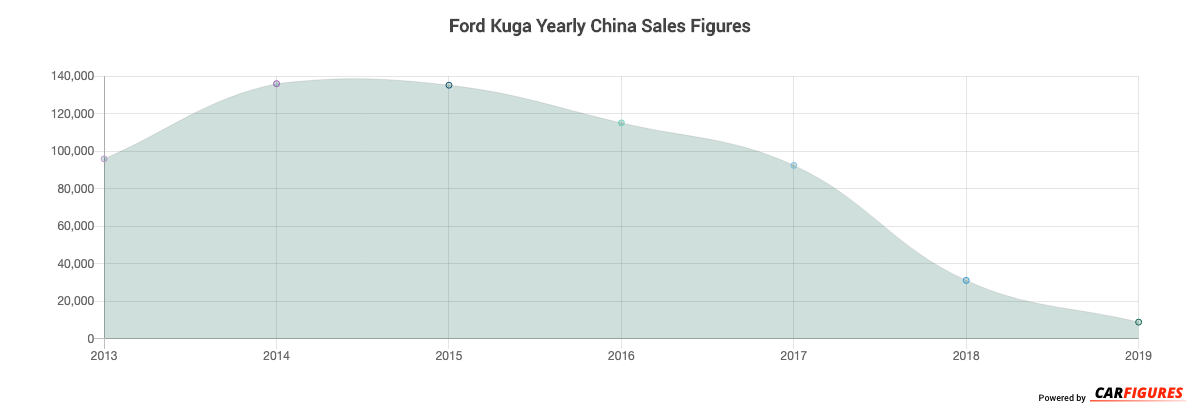
Ford sold 8,898 Kuga in 2019. In 2018, Ford sold 31,149 Kuga. They sold 22,251 more units in year 2018 compared to 2019 with a percent loss of 71.43% YoY.
Overview
The Kuga is a 5 doors 5 seats SUV with room for 5 people.
How Much Does the Ford Kuga Cost?
The Kuga starts at CN¥169,800 Yuan ($23,772 USD) MSRP. Fully equipped, the Kuga will cost you about CN¥249,800 Yuan ($34,972 USD).
Ford Kuga Engine and Performance
Kuga is powered by a 1.5TL engine that makes 133 Kw (178.36 HP) - 180 Kw (241.38 HP) and 240 Nm (177.60 ft-lb) - 350 Nm (259.00 ft-lb) torque.
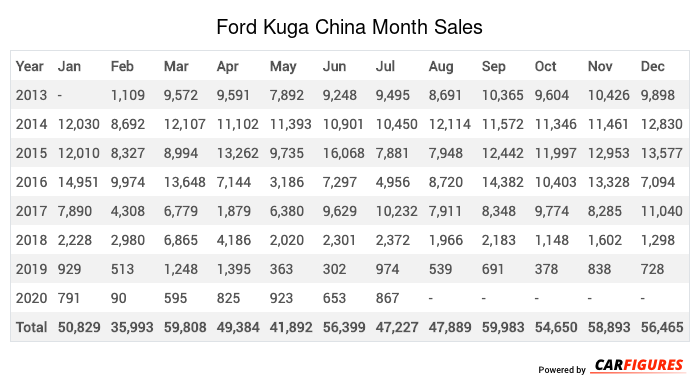
Ford Kuga China Sale figures by year, quarter, and month are presented below. Including the most up to date sales data for the Ford Kuga.
Year | Jan | Feb | Mar | Apr | May | Jun | Jul | Aug | Sep | Oct | Nov | Dec |
|---|---|---|---|---|---|---|---|---|---|---|---|---|
| 2013 | - | 1,109 | 9,572 | 9,591 | 7,892 | 9,248 | 9,495 | 8,691 | 10,365 | 9,604 | 10,426 | 9,898 |
| 2014 | 12,030 | 8,692 | 12,107 | 11,102 | 11,393 | 10,901 | 10,450 | 12,114 | 11,572 | 11,346 | 11,461 | 12,830 |
| 2015 | 12,010 | 8,327 | 8,994 | 13,262 | 9,735 | 16,068 | 7,881 | 7,948 | 12,442 | 11,997 | 12,953 | 13,577 |
| 2016 | 14,951 | 9,974 | 13,648 | 7,144 | 3,186 | 7,297 | 4,956 | 8,720 | 14,382 | 10,403 | 13,328 | 7,094 |
| 2017 | 7,890 | 4,308 | 6,779 | 1,879 | 6,380 | 9,629 | 10,232 | 7,911 | 8,348 | 9,774 | 8,285 | 11,040 |
| 2018 | 2,228 | 2,980 | 6,865 | 4,186 | 2,020 | 2,301 | 2,372 | 1,966 | 2,183 | 1,148 | 1,602 | 1,298 |
| 2019 | 929 | 513 | 1,248 | 1,395 | 363 | 302 | 974 | 539 | 691 | 378 | 838 | 728 |
| 2020 | 791 | 90 | 595 | 825 | 923 | 653 | 867 | - | - | - | - | - |
| Total | 50,829 | 35,993 | 59,808 | 49,384 | 41,892 | 56,399 | 47,227 | 47,889 | 59,983 | 54,650 | 58,893 | 56,465 |
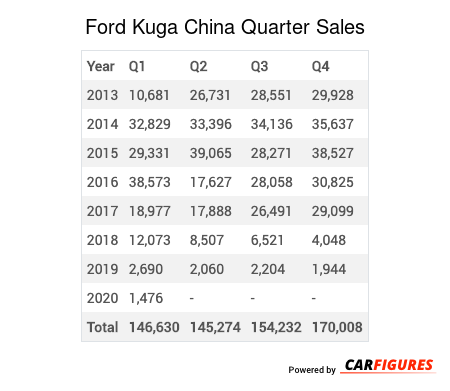
Year | Q1 | Q2 | Q3 | Q4 |
|---|---|---|---|---|
| 2013 | 10,681 | 26,731 | 28,551 | 29,928 |
| 2014 | 32,829 | 33,396 | 34,136 | 35,637 |
| 2015 | 29,331 | 39,065 | 28,271 | 38,527 |
| 2016 | 38,573 | 17,627 | 28,058 | 30,825 |
| 2017 | 18,977 | 17,888 | 26,491 | 29,099 |
| 2018 | 12,073 | 8,507 | 6,521 | 4,048 |
| 2019 | 2,690 | 2,060 | 2,204 | 1,944 |
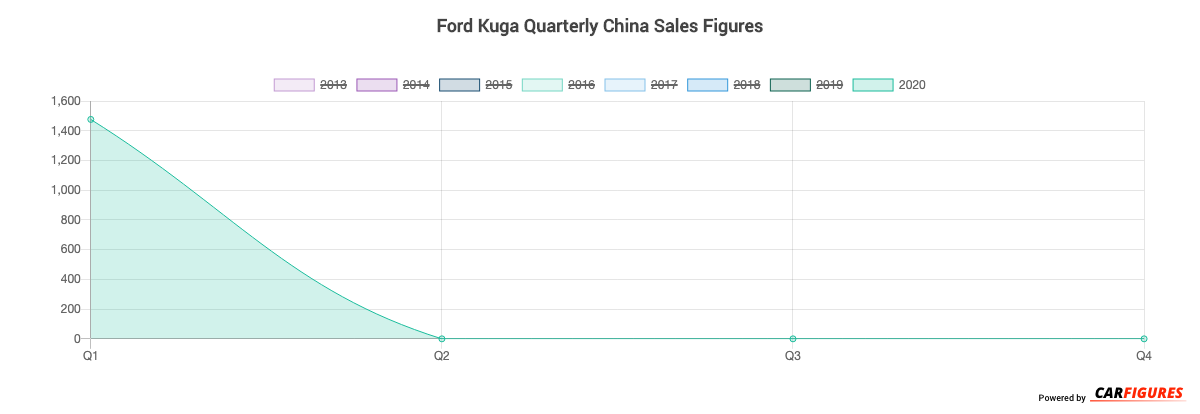
| 2020 | 1,476 | - | - | - |
| Total | 146,630 | 145,274 | 154,232 | 170,008 |
Year | Sales |
|---|---|
| 2020 | 1,476 |
| 2019 | 8,898 |
| 2018 | 31,149 |
| 2017 | 92,455 |
| 2016 | 115,083 |
| 2015 | 135,194 |
| 2014 | 135,998 |
| 2013 | 95,891 |
| Total | 616,144 |
Download Historic Sales Data
Embedded Code
See more widgetsSources: Manufacturers