Last updated: May 15, 2020
Key Stats
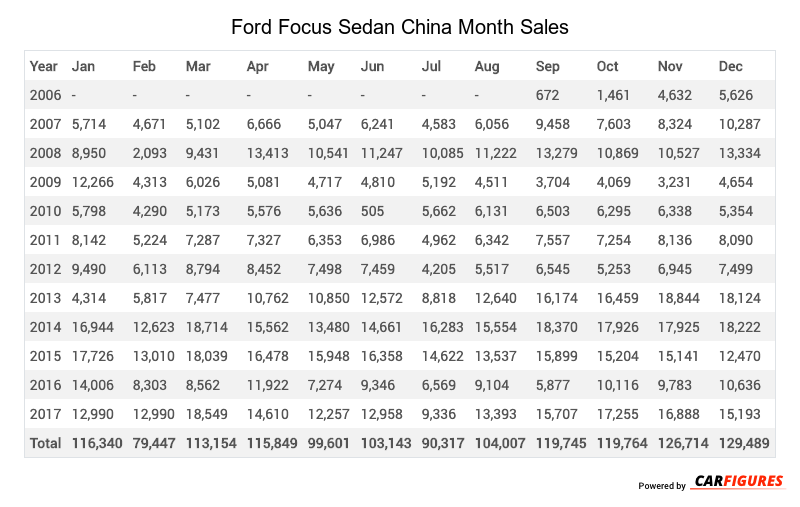
How many Focus Sedan did Ford sell in December 2017?
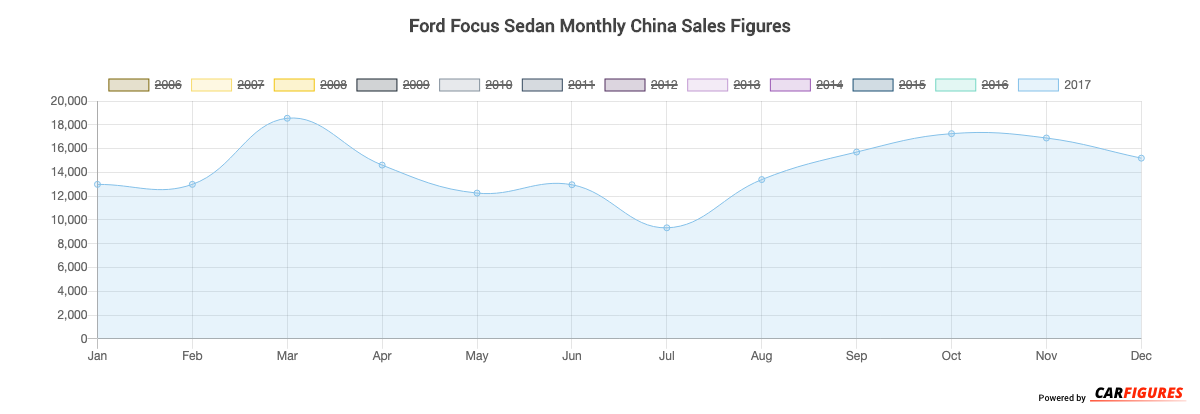
Ford sold 15,193 Focus Sedan in December 2017.
Overview
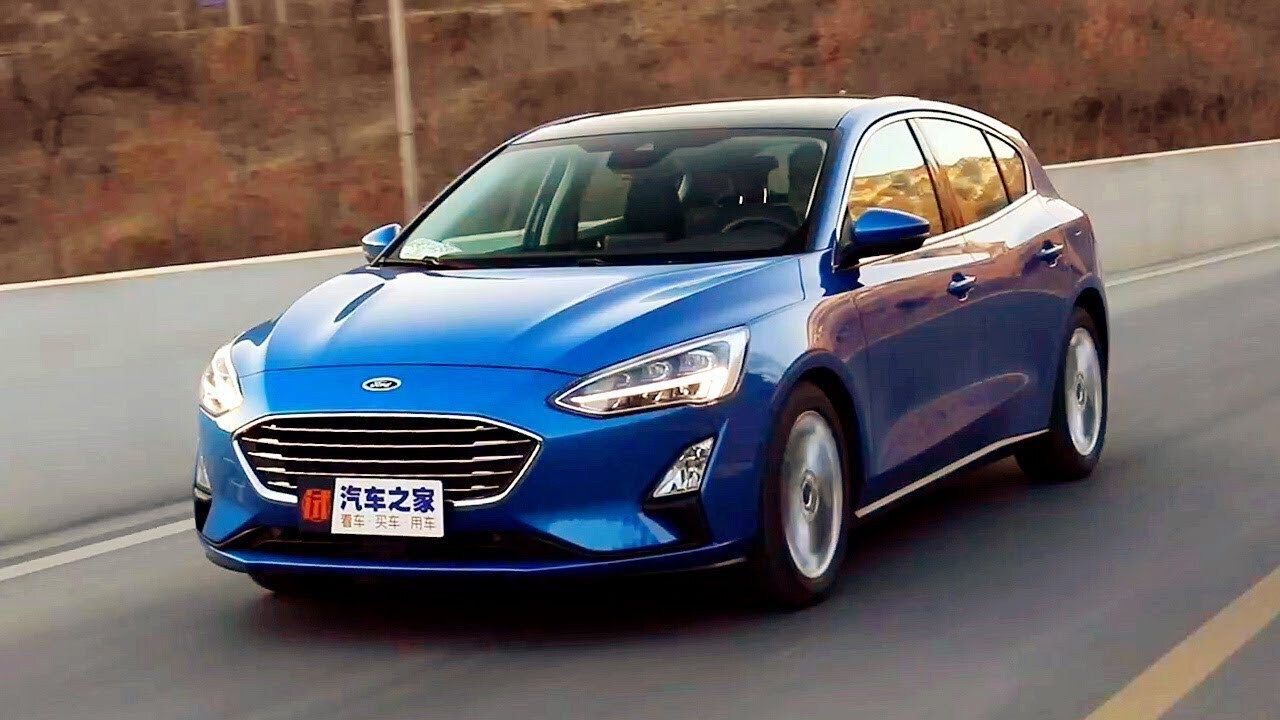
The Focus Sedan is a vehicle from automaker Ford.
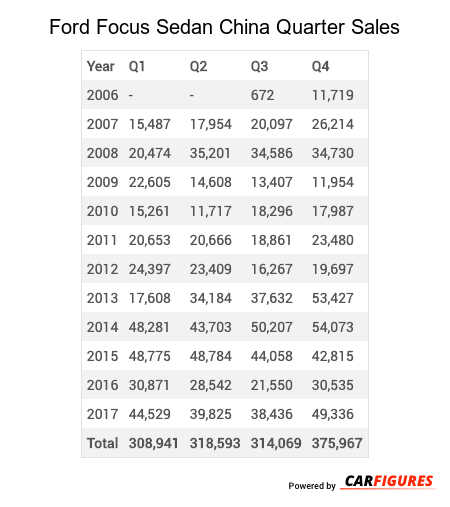
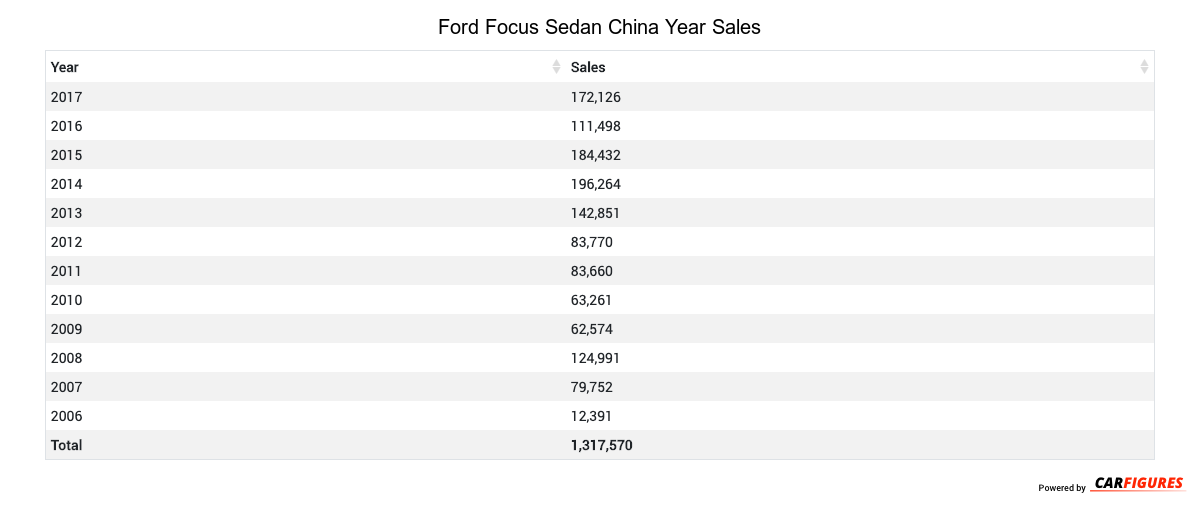
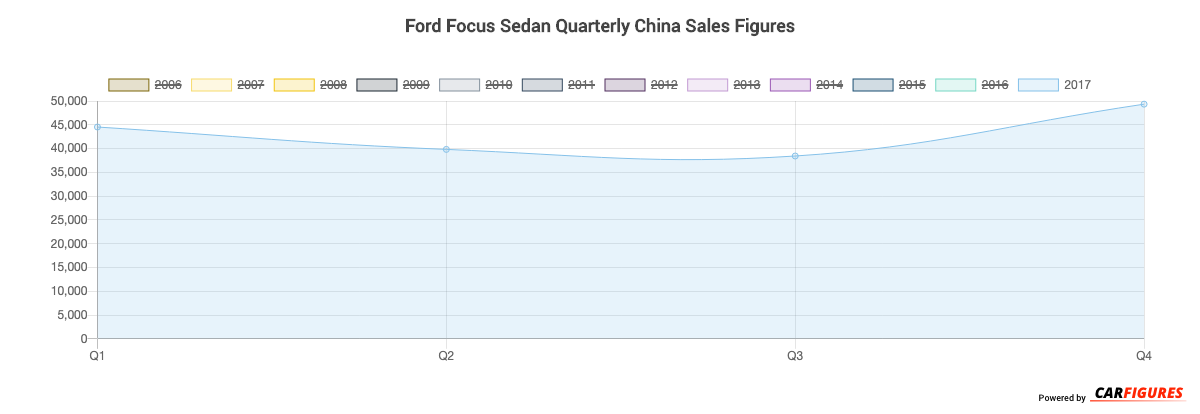
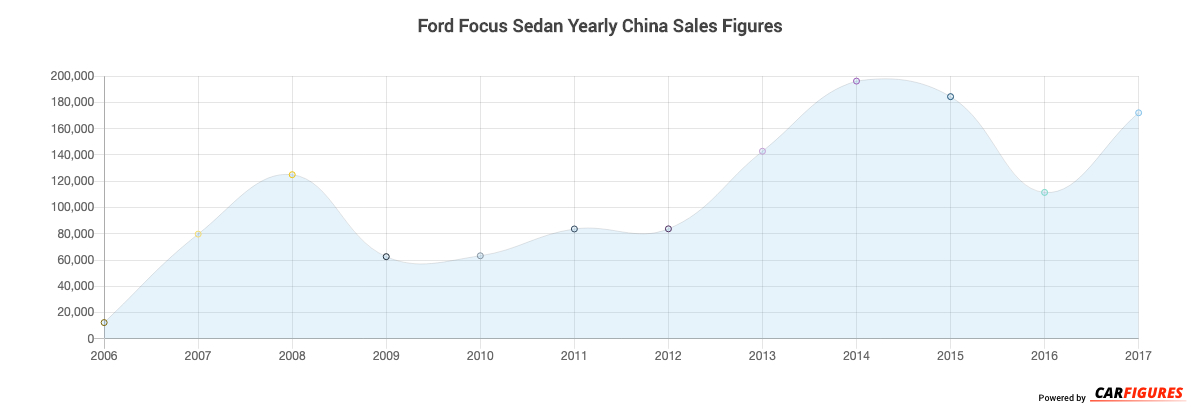
Ford Focus Sedan China Sale figures by year, quarter, and month are presented below. Including the most up to date sales data for the Ford Focus Sedan.
Loading, please wait
Year | Jan | Feb | Mar | Apr | May | Jun | Jul | Aug | Sep | Oct | Nov | Dec |
|---|---|---|---|---|---|---|---|---|---|---|---|---|
| 2006 | - | - | - | - | - | - | - | - | 672 | 1,461 | 4,632 | 5,626 |
| 2007 | 5,714 | 4,671 | 5,102 | 6,666 | 5,047 | 6,241 | 4,583 | 6,056 | 9,458 | 7,603 | 8,324 | 10,287 |
| 2008 | 8,950 | 2,093 | 9,431 | 13,413 | 10,541 | 11,247 | 10,085 | 11,222 | 13,279 | 10,869 | 10,527 | 13,334 |
| 2009 | 12,266 | 4,313 | 6,026 | 5,081 | 4,717 | 4,810 | 5,192 | 4,511 | 3,704 | 4,069 | 3,231 | 4,654 |
| 2010 | 5,798 | 4,290 | 5,173 | 5,576 | 5,636 | 505 | 5,662 | 6,131 | 6,503 | 6,295 | 6,338 | 5,354 |
| 2011 | 8,142 | 5,224 | 7,287 | 7,327 | 6,353 | 6,986 | 4,962 | 6,342 | 7,557 | 7,254 | 8,136 | 8,090 |
| 2012 | 9,490 | 6,113 | 8,794 | 8,452 | 7,498 | 7,459 | 4,205 | 5,517 | 6,545 | 5,253 | 6,945 | 7,499 |
| 2013 | 4,314 | 5,817 | 7,477 | 10,762 | 10,850 | 12,572 | 8,818 | 12,640 | 16,174 | 16,459 | 18,844 | 18,124 |
| 2014 | 16,944 | 12,623 | 18,714 | 15,562 | 13,480 | 14,661 | 16,283 | 15,554 | 18,370 | 17,926 | 17,925 | 18,222 |
| 2015 | 17,726 | 13,010 | 18,039 | 16,478 | 15,948 | 16,358 | 14,622 | 13,537 | 15,899 | 15,204 | 15,141 | 12,470 |
| 2016 | 14,006 | 8,303 | 8,562 | 11,922 | 7,274 | 9,346 | 6,569 | 9,104 | 5,877 | 10,116 | 9,783 | 10,636 |
| 2017 | 12,990 | 12,990 | 18,549 | 14,610 | 12,257 | 12,958 | 9,336 | 13,393 | 15,707 | 17,255 | 16,888 | 15,193 |
| Total | 116,340 | 79,447 | 113,154 | 115,849 | 99,601 | 103,143 | 90,317 | 104,007 | 119,745 | 119,764 | 126,714 | 129,489 |
Loading, please wait
Year | Q1 | Q2 | Q3 | Q4 |
|---|---|---|---|---|
| 2006 | - | - | 672 | 11,719 |
| 2007 | 15,487 | 17,954 | 20,097 | 26,214 |
| 2008 | 20,474 | 35,201 | 34,586 | 34,730 |
| 2009 | 22,605 | 14,608 | 13,407 | 11,954 |
| 2010 | 15,261 | 11,717 | 18,296 | 17,987 |
| 2011 | 20,653 | 20,666 | 18,861 | 23,480 |
| 2012 | 24,397 | 23,409 | 16,267 | 19,697 |
| 2013 | 17,608 | 34,184 | 37,632 | 53,427 |
| 2014 | 48,281 | 43,703 | 50,207 | 54,073 |
| 2015 | 48,775 | 48,784 | 44,058 | 42,815 |
| 2016 | 30,871 | 28,542 | 21,550 | 30,535 |
| 2017 | 44,529 | 39,825 | 38,436 | 49,336 |
| Total | 308,941 | 318,593 | 314,069 | 375,967 |
Loading, please wait
Year | Sales |
|---|---|
| 2017 | 172,126 |
| 2016 | 111,498 |
| 2015 | 184,432 |
| 2014 | 196,264 |
| 2013 | 142,851 |
| 2012 | 83,770 |
| 2011 | 83,660 |
| 2010 | 63,261 |
| 2009 | 62,574 |
| 2008 | 124,991 |
| 2007 | 79,752 |
| 2006 | 12,391 |
| Total | 1,317,570 |
Download Historic Sales Data
Embedded Code
See more widgetsSources: Manufacturers