Key Stats
How many V3 did Brilliance Auto sell in 2020?
Brilliance Auto sold 1,981 V3 in 2020. (From Jan - Dec 2020)
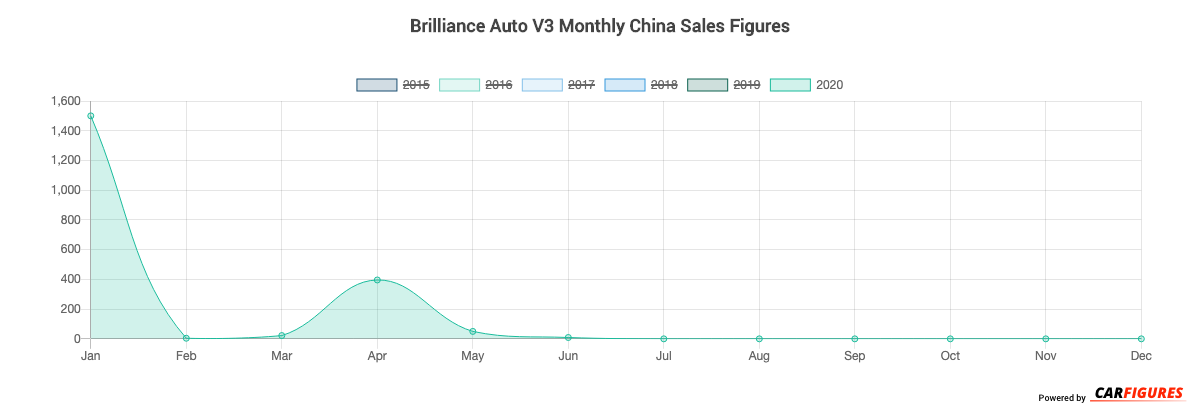
How many V3 did Brilliance Auto sell in June 2020?
Brilliance Auto sold 9 V3 in June 2020.
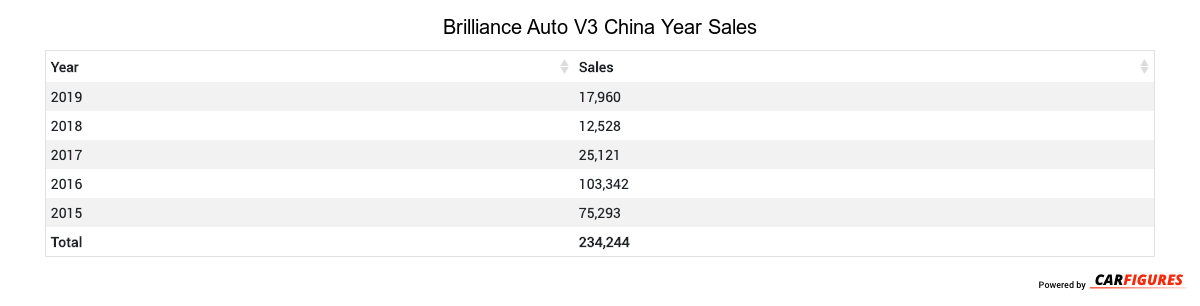
How many V3 did Brilliance Auto sell in 2019?
Brilliance Auto sold 17,960 V3 in 2019. In 2018, Brilliance Auto sold 12,528 V3. They sold 5,432 more units in 2019 compared to 2018 with a percent gain of 43.36% YoY.
Overview
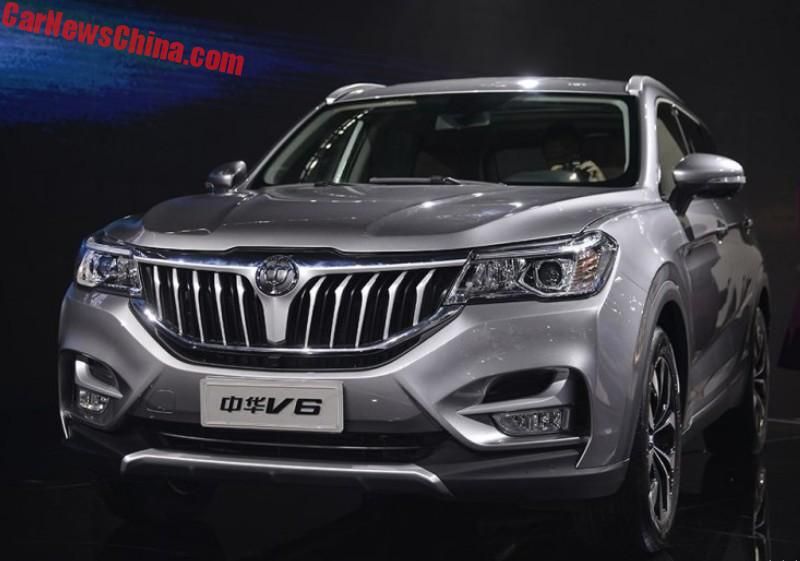
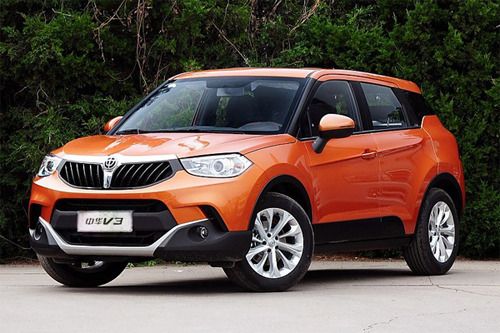
The V3 is a 5 doors 5 seats SUV with room for 5 people.
How Much Does the Brilliance Auto V3 Cost?
The V3 starts at CN¥53,700 Yuan ($7,518 USD) MSRP. Fully equipped, the V3 will cost you about CN¥87,700 Yuan ($12,278 USD).
Brilliance Auto V3 Engine and Performance
V3 is powered by a 1.6L L engine that makes 82 Kw (109.96 HP) - 110 Kw (147.51 HP) and 145 Nm (107.30 ft-lb) - 220 Nm (162.80 ft-lb) torque.
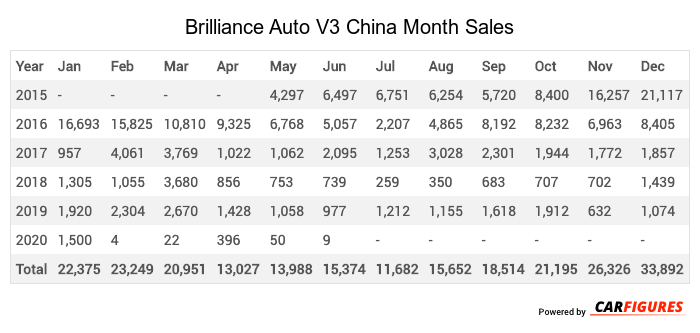
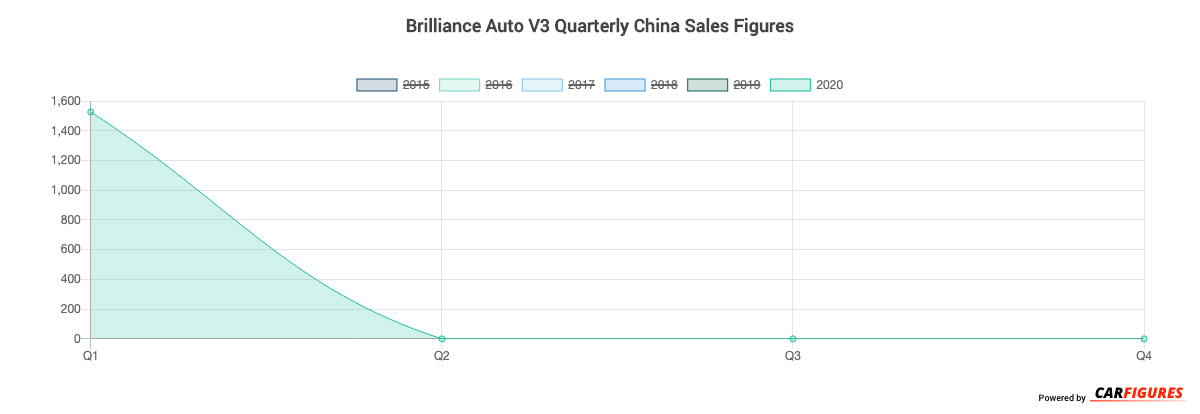
Brilliance Auto V3 China Sale figures by year, quarter, and month are presented below. Including the most up to date sales data for the Brilliance Auto V3.
Year | Jan | Feb | Mar | Apr | May | Jun | Jul | Aug | Sep | Oct | Nov | Dec |
|---|---|---|---|---|---|---|---|---|---|---|---|---|
| 2015 | - | - | - | - | 4,297 | 6,497 | 6,751 | 6,254 | 5,720 | 8,400 | 16,257 | 21,117 |
| 2016 | 16,693 | 15,825 | 10,810 | 9,325 | 6,768 | 5,057 | 2,207 | 4,865 | 8,192 | 8,232 | 6,963 | 8,405 |
| 2017 | 957 | 4,061 | 3,769 | 1,022 | 1,062 | 2,095 | 1,253 | 3,028 | 2,301 | 1,944 | 1,772 | 1,857 |
| 2018 | 1,305 | 1,055 | 3,680 | 856 | 753 | 739 | 259 | 350 | 683 | 707 | 702 | 1,439 |
| 2019 | 1,920 | 2,304 | 2,670 | 1,428 | 1,058 | 977 | 1,212 | 1,155 | 1,618 | 1,912 | 632 | 1,074 |
| 2020 | 1,500 | 4 | 22 | 396 | 50 | 9 | - | - | - | - | - | - |
| Total | 22,375 | 23,249 | 20,951 | 13,027 | 13,988 | 15,374 | 11,682 | 15,652 | 18,514 | 21,195 | 26,326 | 33,892 |
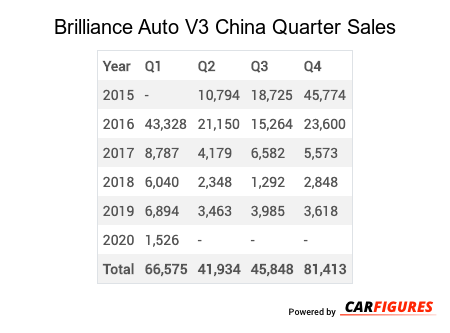
Year | Q1 | Q2 | Q3 | Q4 |
|---|---|---|---|---|
| 2015 | - | 10,794 | 18,725 | 45,774 |
| 2016 | 43,328 | 21,150 | 15,264 | 23,600 |
| 2017 | 8,787 | 4,179 | 6,582 | 5,573 |
| 2018 | 6,040 | 2,348 | 1,292 | 2,848 |
| 2019 | 6,894 | 3,463 | 3,985 | 3,618 |
| 2020 | 1,526 | - | - | - |
| Total | 66,575 | 41,934 | 45,848 | 81,413 |
Year | Sales |
|---|---|
| 2020 | 1,526 |
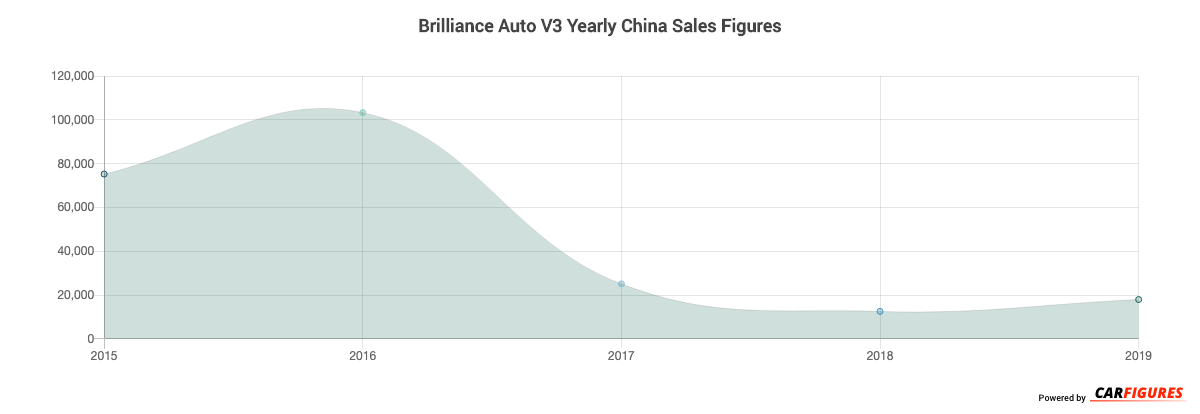
| 2019 | 17,960 |
| 2018 | 12,528 |
| 2017 | 25,121 |
| 2016 | 103,342 |
| 2015 | 75,293 |
| Total | 235,770 |
Download Historic Sales Data
Embedded Code
See more widgetsSources: Manufacturers