Key Stats
How many Junjie FSV did Brilliance Auto sell in 2020?
Brilliance Auto sold 562 Junjie FSV in 2020. (From Jan - Dec 2020)
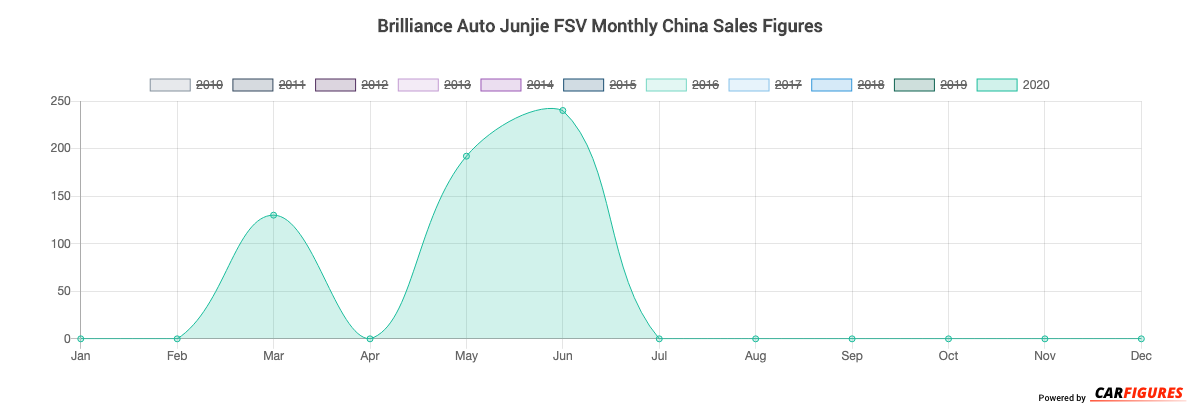
How many Junjie FSV did Brilliance Auto sell in June 2020?
Brilliance Auto sold 240 Junjie FSV in June 2020.
How many Junjie FSV did Brilliance Auto sell in 2019?
Brilliance Auto sold 1,027 Junjie FSV in 2019. In 2018, Brilliance Auto sold 161 Junjie FSV. They sold 866 more units in 2019 compared to 2018 with a percent gain of 537.89% YoY.
Overview
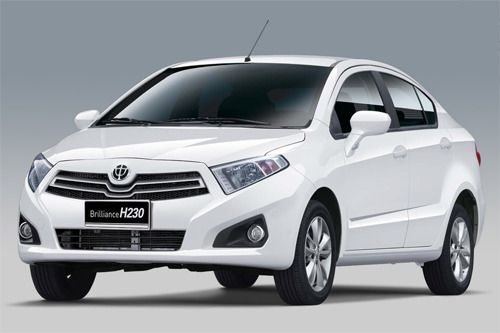
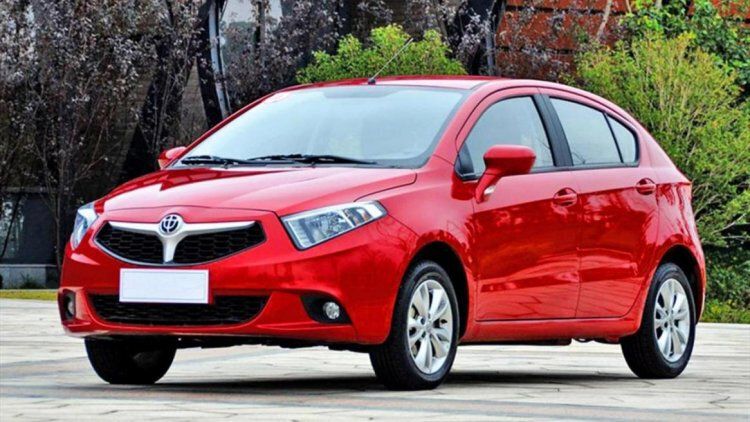
The Junjie FSV is a vehicle from automaker Brilliance Auto.
How Much Does the Brilliance Auto Junjie FSV Cost?
Pricing for the Junjie FSV starts at CN¥65,800 Yuan ($9,212 USD) MSRP and goes up to CN¥95,800 Yuan ($13,412 USD) fully equipped.
Brilliance Auto Junjie FSV Engine and Performance
Junjie FSV is powered by a 1.5LL engine that makes 75 Kw (100.58 HP) - 77 Kw (103.26 HP) and 135 Nm (99.90 ft-lb) - 141 Nm (104.34 ft-lb) torque.
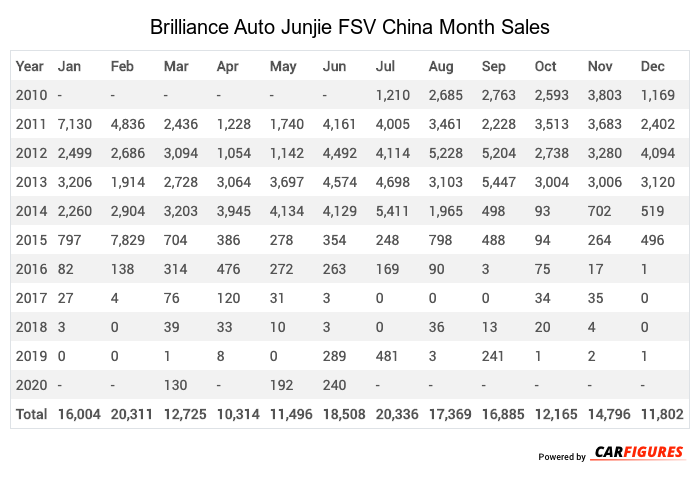
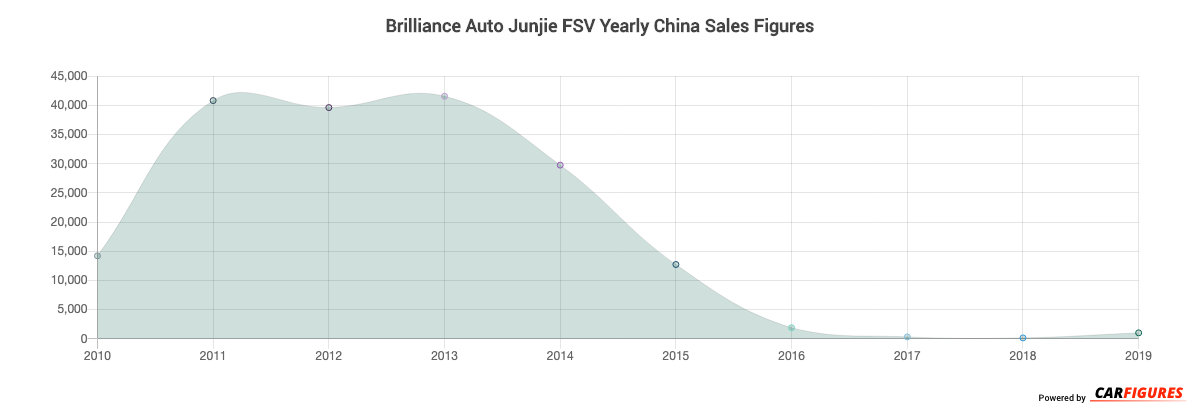
Brilliance Auto Junjie FSV China Sale figures by year, quarter, and month are presented below. Including the most up to date sales data for the Brilliance Auto Junjie FSV.
Year | Jan | Feb | Mar | Apr | May | Jun | Jul | Aug | Sep | Oct | Nov | Dec |
|---|---|---|---|---|---|---|---|---|---|---|---|---|
| 2010 | - | - | - | - | - | - | 1,210 | 2,685 | 2,763 | 2,593 | 3,803 | 1,169 |
| 2011 | 7,130 | 4,836 | 2,436 | 1,228 | 1,740 | 4,161 | 4,005 | 3,461 | 2,228 | 3,513 | 3,683 | 2,402 |
| 2012 | 2,499 | 2,686 | 3,094 | 1,054 | 1,142 | 4,492 | 4,114 | 5,228 | 5,204 | 2,738 | 3,280 | 4,094 |
| 2013 | 3,206 | 1,914 | 2,728 | 3,064 | 3,697 | 4,574 | 4,698 | 3,103 | 5,447 | 3,004 | 3,006 | 3,120 |
| 2014 | 2,260 | 2,904 | 3,203 | 3,945 | 4,134 | 4,129 | 5,411 | 1,965 | 498 | 93 | 702 | 519 |
| 2015 | 797 | 7,829 | 704 | 386 | 278 | 354 | 248 | 798 | 488 | 94 | 264 | 496 |
| 2016 | 82 | 138 | 314 | 476 | 272 | 263 | 169 | 90 | 3 | 75 | 17 | 1 |
| 2017 | 27 | 4 | 76 | 120 | 31 | 3 | 0 | 0 | 0 | 34 | 35 | 0 |
| 2018 | 3 | 0 | 39 | 33 | 10 | 3 | 0 | 36 | 13 | 20 | 4 | 0 |
| 2019 | 0 | 0 | 1 | 8 | 0 | 289 | 481 | 3 | 241 | 1 | 2 | 1 |
| 2020 | - | - | 130 | - | 192 | 240 | - | - | - | - | - | - |
| Total | 16,004 | 20,311 | 12,725 | 10,314 | 11,496 | 18,508 | 20,336 | 17,369 | 16,885 | 12,165 | 14,796 | 11,802 |
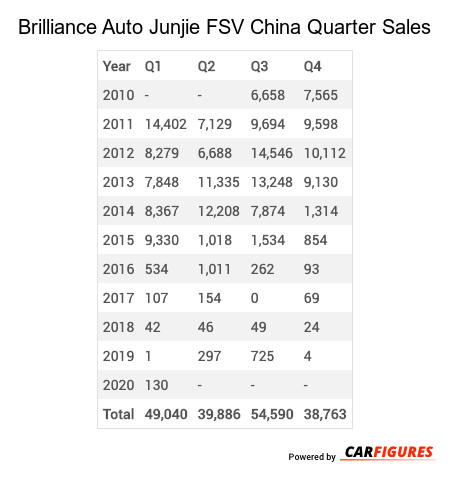
Year | Q1 | Q2 | Q3 | Q4 |
|---|---|---|---|---|
| 2010 | - | - | 6,658 | 7,565 |
| 2011 | 14,402 | 7,129 | 9,694 | 9,598 |
| 2012 | 8,279 | 6,688 | 14,546 | 10,112 |
| 2013 | 7,848 | 11,335 | 13,248 | 9,130 |
| 2014 | 8,367 | 12,208 | 7,874 | 1,314 |
| 2015 | 9,330 | 1,018 | 1,534 | 854 |
| 2016 | 534 | 1,011 | 262 | 93 |
| 2017 | 107 | 154 | 0 | 69 |
| 2018 | 42 | 46 | 49 | 24 |
| 2019 | 1 | 297 | 725 | 4 |
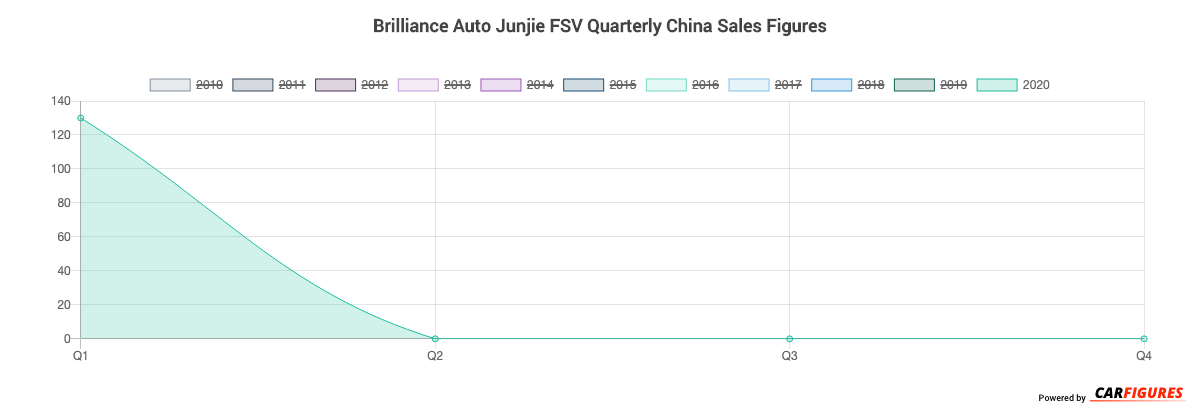
| 2020 | 130 | - | - | - |
| Total | 49,040 | 39,886 | 54,590 | 38,763 |
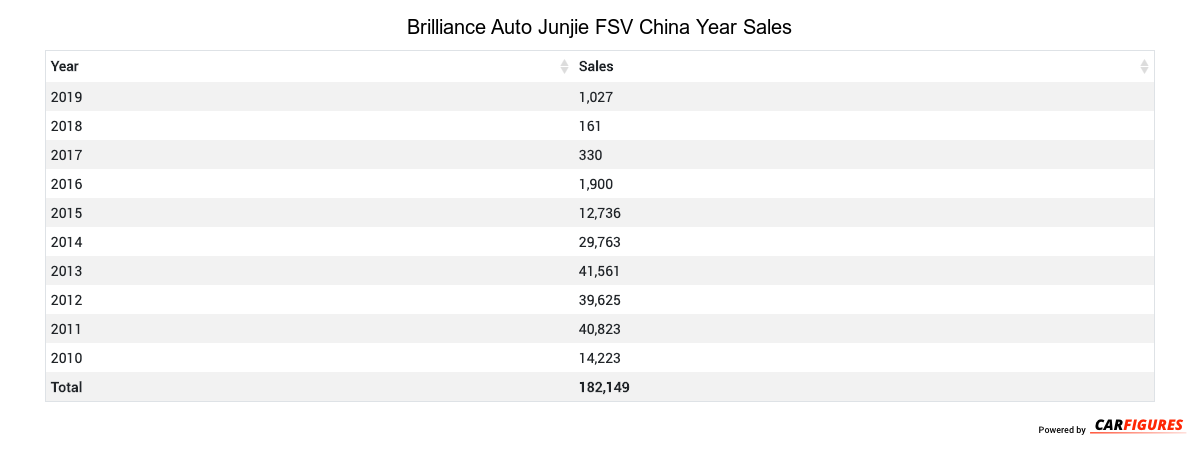
Year | Sales |
|---|---|
| 2020 | 130 |
| 2019 | 1,027 |
| 2018 | 161 |
| 2017 | 330 |
| 2016 | 1,900 |
| 2015 | 12,736 |
| 2014 | 29,763 |
| 2013 | 41,561 |
| 2012 | 39,625 |
| 2011 | 40,823 |
| 2010 | 14,223 |
| Total | 182,279 |
Download Historic Sales Data
Embedded Code
See more widgetsSources: Manufacturers