Key Stats
How many H530 did Brilliance Auto sell in 2020?
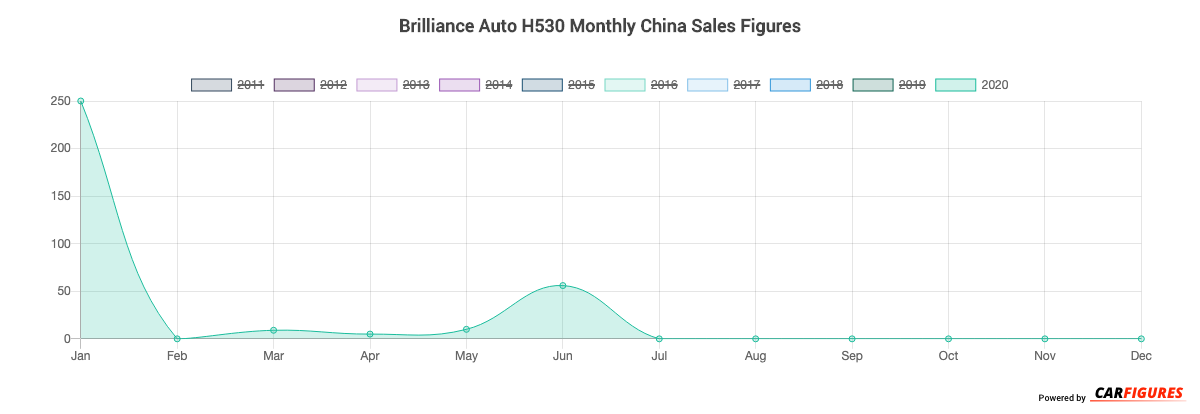
Brilliance Auto sold 330 H530 in 2020. (From Jan - Dec 2020)
How many H530 did Brilliance Auto sell in June 2020?
Brilliance Auto sold 56 H530 in June 2020.
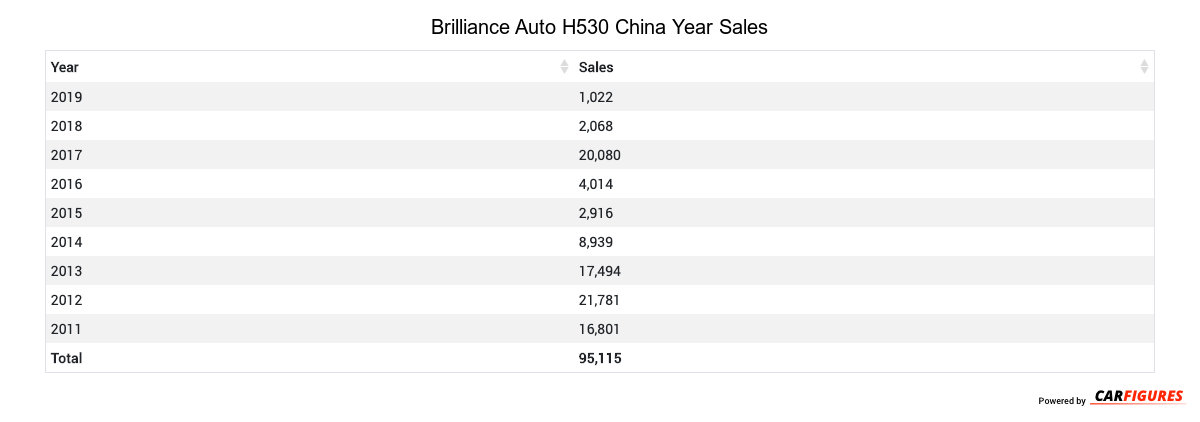
How many H530 did Brilliance Auto sell in 2019?
Brilliance Auto sold 1,022 H530 in 2019. In 2018, Brilliance Auto sold 2,068 H530. They sold 1,046 more units in year 2018 compared to 2019 with a percent loss of 50.58% YoY.
Overview
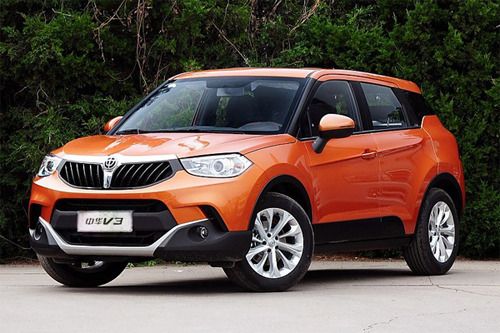
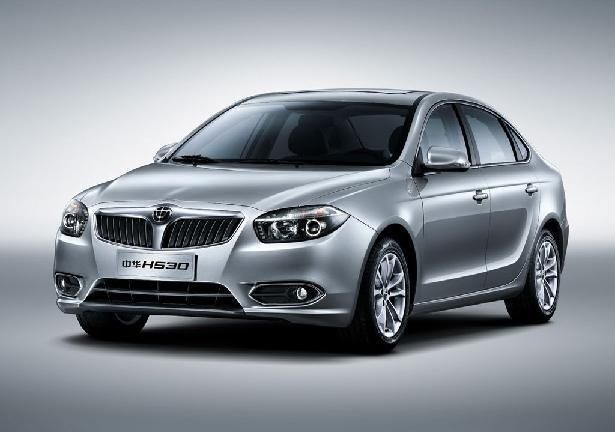
The H530 is a 4-door 5-seater sedan with room for 5 people from automaker Brilliance Auto.
How Much Does the Brilliance Auto H530 Cost?
Pricing for the H530 starts at CN¥85,800 Yuan ($12,012 USD) MSRP and goes up to CN¥125,800 Yuan ($17,612 USD) fully equipped.
Brilliance Auto H530 Engine and Performance
H530 includes a 1.6LL engine. This delivers 87 Kw (116.67 HP) - 110 Kw (147.51 HP) and 151 Nm (111.74 ft-lb) - 220 Nm (162.80 ft-lb) torque.
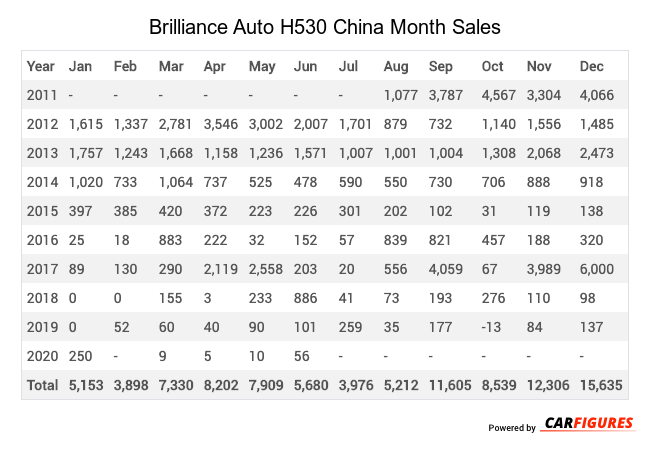
Brilliance Auto H530 China Sale figures by year, quarter, and month are presented below. Including the most up to date sales data for the Brilliance Auto H530.
Year | Jan | Feb | Mar | Apr | May | Jun | Jul | Aug | Sep | Oct | Nov | Dec |
|---|---|---|---|---|---|---|---|---|---|---|---|---|
| 2011 | - | - | - | - | - | - | - | 1,077 | 3,787 | 4,567 | 3,304 | 4,066 |
| 2012 | 1,615 | 1,337 | 2,781 | 3,546 | 3,002 | 2,007 | 1,701 | 879 | 732 | 1,140 | 1,556 | 1,485 |
| 2013 | 1,757 | 1,243 | 1,668 | 1,158 | 1,236 | 1,571 | 1,007 | 1,001 | 1,004 | 1,308 | 2,068 | 2,473 |
| 2014 | 1,020 | 733 | 1,064 | 737 | 525 | 478 | 590 | 550 | 730 | 706 | 888 | 918 |
| 2015 | 397 | 385 | 420 | 372 | 223 | 226 | 301 | 202 | 102 | 31 | 119 | 138 |
| 2016 | 25 | 18 | 883 | 222 | 32 | 152 | 57 | 839 | 821 | 457 | 188 | 320 |
| 2017 | 89 | 130 | 290 | 2,119 | 2,558 | 203 | 20 | 556 | 4,059 | 67 | 3,989 | 6,000 |
| 2018 | 0 | 0 | 155 | 3 | 233 | 886 | 41 | 73 | 193 | 276 | 110 | 98 |
| 2019 | 0 | 52 | 60 | 40 | 90 | 101 | 259 | 35 | 177 | -13 | 84 | 137 |
| 2020 | 250 | - | 9 | 5 | 10 | 56 | - | - | - | - | - | - |
| Total | 5,153 | 3,898 | 7,330 | 8,202 | 7,909 | 5,680 | 3,976 | 5,212 | 11,605 | 8,539 | 12,306 | 15,635 |
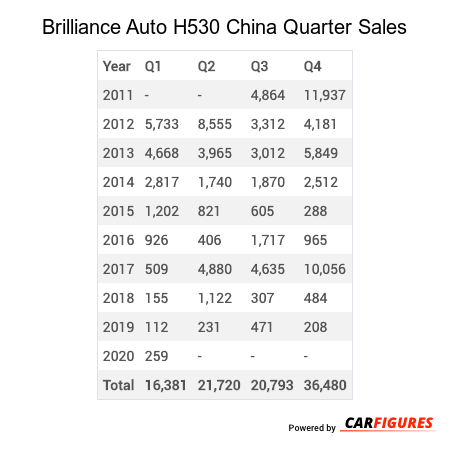
Year | Q1 | Q2 | Q3 | Q4 |
|---|---|---|---|---|
| 2011 | - | - | 4,864 | 11,937 |
| 2012 | 5,733 | 8,555 | 3,312 | 4,181 |
| 2013 | 4,668 | 3,965 | 3,012 | 5,849 |
| 2014 | 2,817 | 1,740 | 1,870 | 2,512 |
| 2015 | 1,202 | 821 | 605 | 288 |
| 2016 | 926 | 406 | 1,717 | 965 |
| 2017 | 509 | 4,880 | 4,635 | 10,056 |
| 2018 | 155 | 1,122 | 307 | 484 |
| 2019 | 112 | 231 | 471 | 208 |
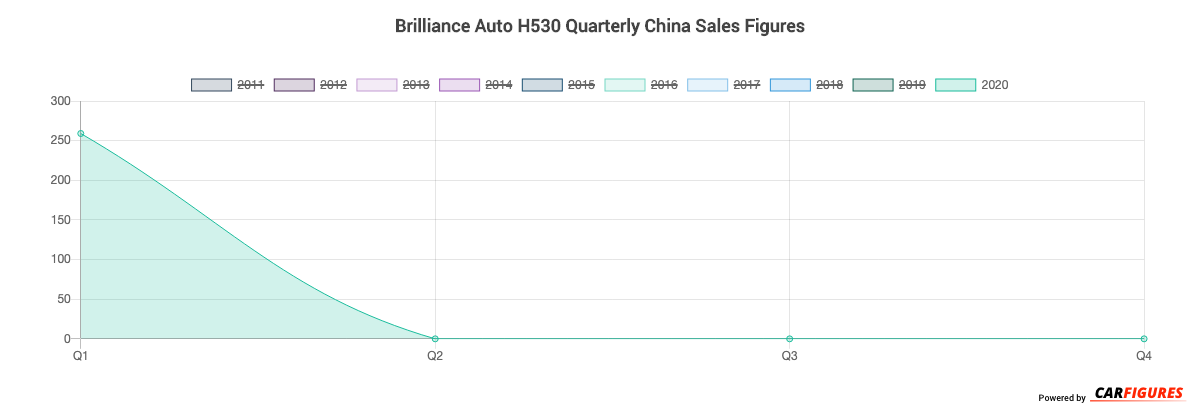
| 2020 | 259 | - | - | - |
| Total | 16,381 | 21,720 | 20,793 | 36,480 |
Year | Sales |
|---|---|
| 2020 | 259 |
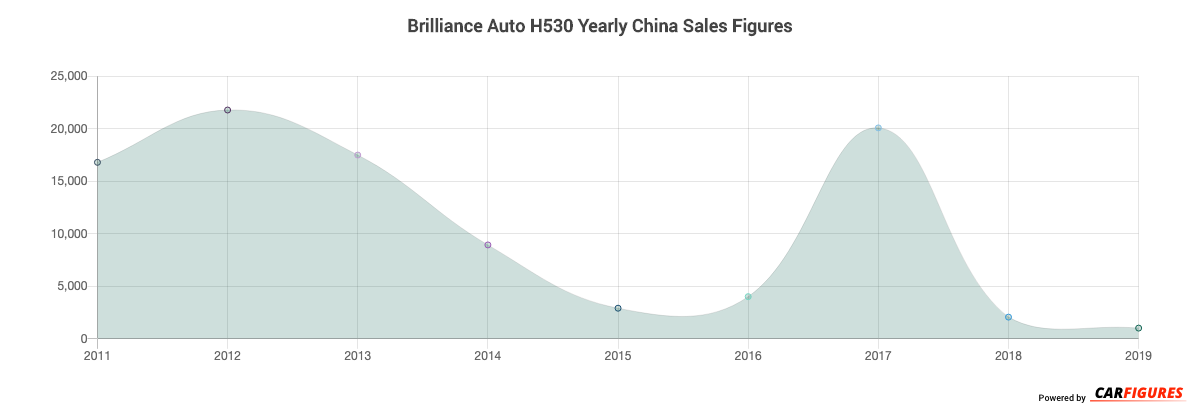
| 2019 | 1,022 |
| 2018 | 2,068 |
| 2017 | 20,080 |
| 2016 | 4,014 |
| 2015 | 2,916 |
| 2014 | 8,939 |
| 2013 | 17,494 |
| 2012 | 21,781 |
| 2011 | 16,801 |
| Total | 95,374 |
Download Historic Sales Data
Embedded Code
See more widgetsSources: Manufacturers