Last updated: July 09, 2020
Key Stats
How many Junjie FRV did Brilliance Auto sell in September 2018?
Brilliance Auto sold 720 Junjie FRV in September 2018.
Overview
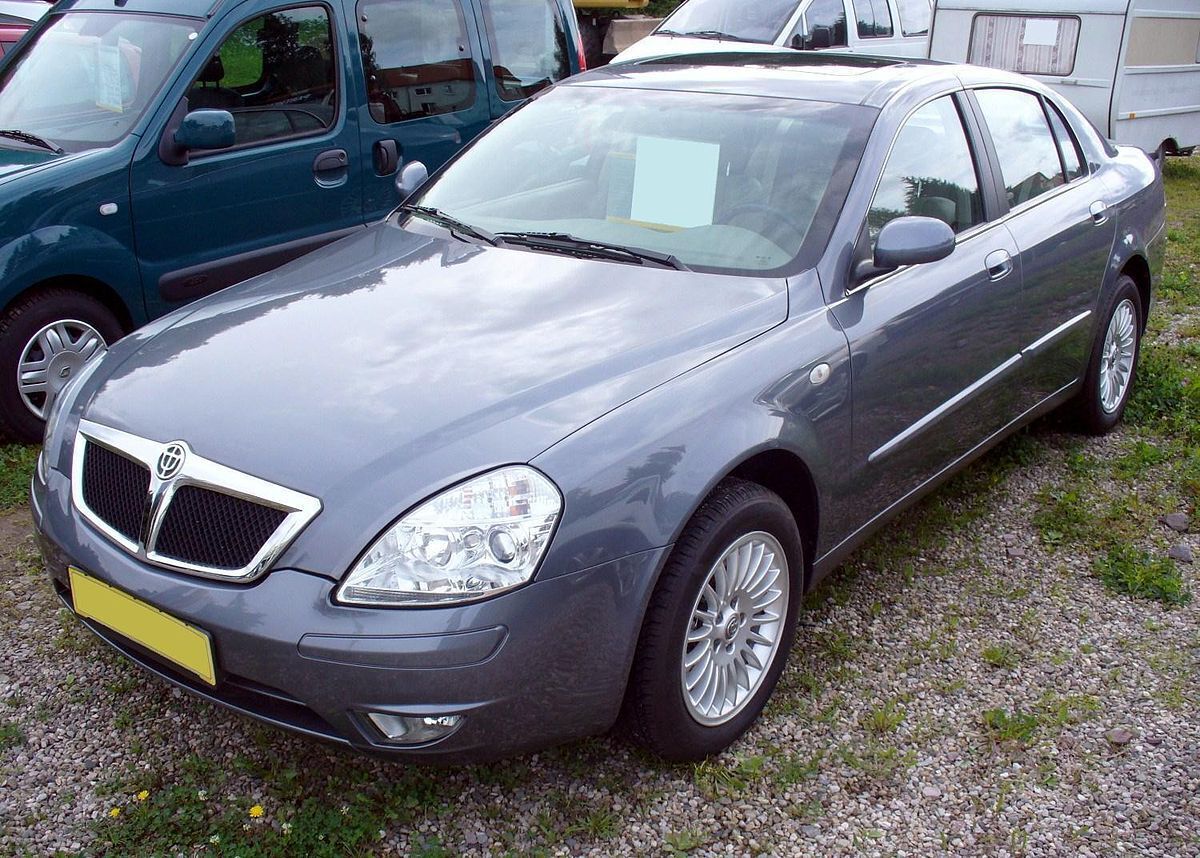
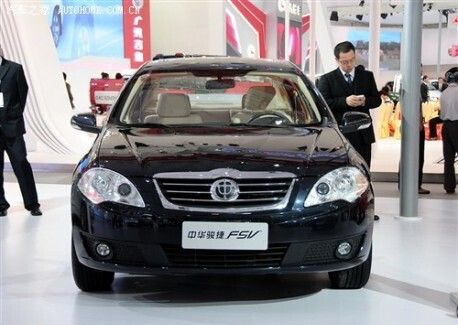
The Junjie FRV is a vehicle from automaker Brilliance Auto.
How Much Does the Brilliance Auto Junjie FRV Cost?
The Junjie FRV starts at CN¥57,300 Yuan ($8,022 USD) MSRP. Fully equipped, the Junjie FRV will cost you about CN¥85,300 Yuan ($11,942 USD).
Brilliance Auto Junjie FRV Engine and Performance
Junjie FRV is powered by a 1.3L engine that makes 65 Kw (87.17 HP) - 77 Kw (103.26 HP) and 120 Nm (88.80 ft-lb) - 141 Nm (104.34 ft-lb) torque.
Brilliance Auto Junjie FRV Specifications
The Junjie FRV has a curb weight of 1,200 kg (2,700 lbs) - 1,200 kg (2,700 lbs).
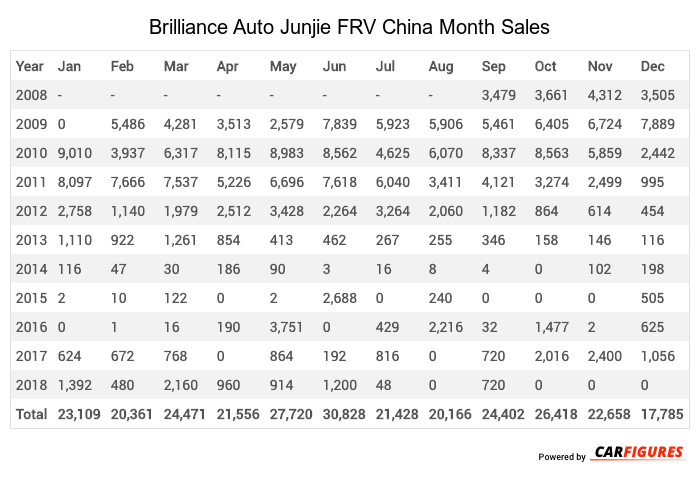
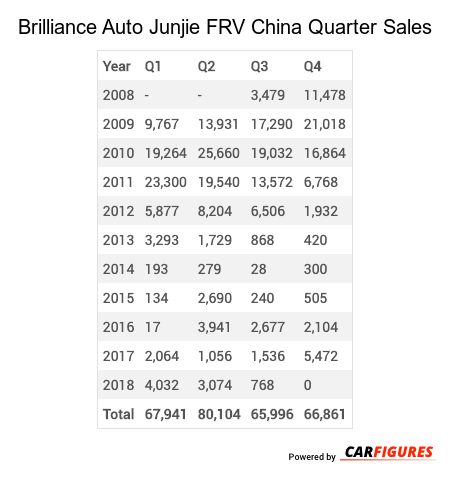
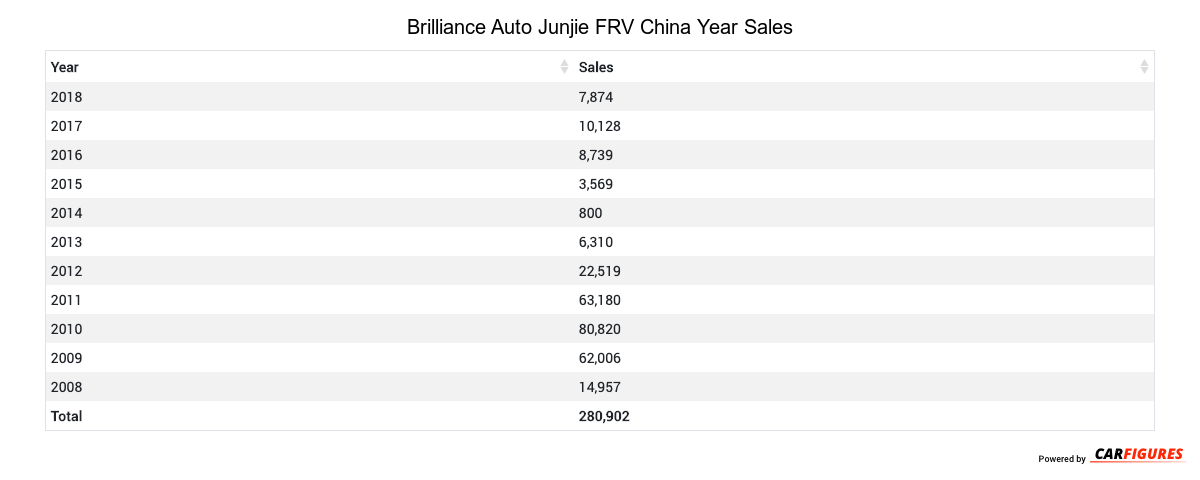
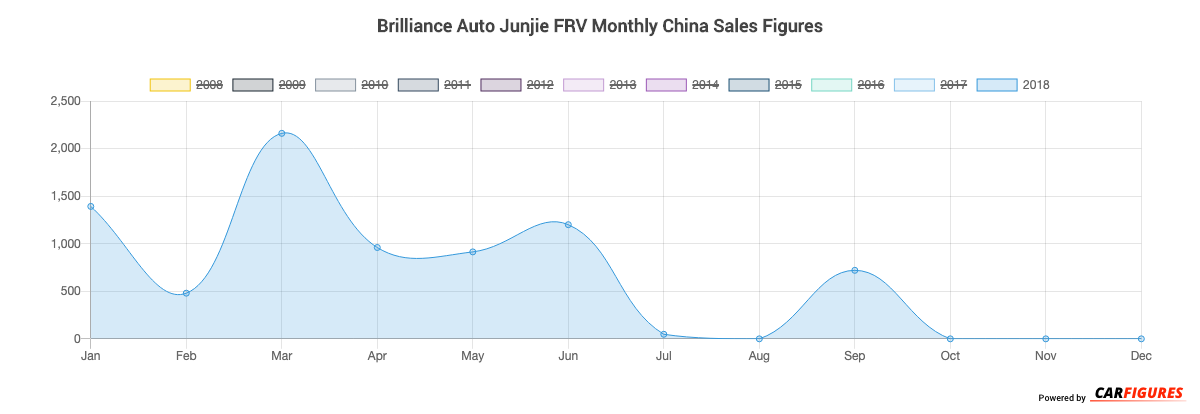
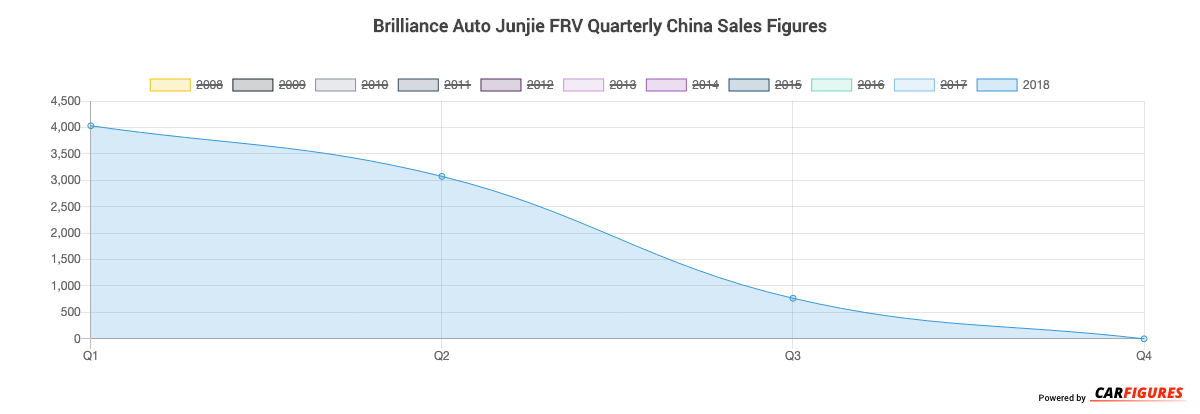
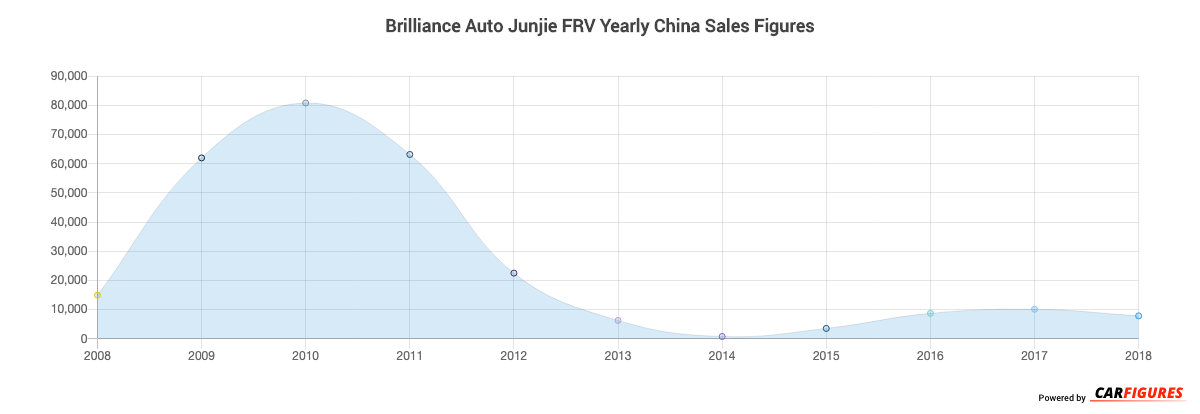
Brilliance Auto Junjie FRV China Sale figures by year, quarter, and month are presented below. Including the most up to date sales data for the Brilliance Auto Junjie FRV.
Loading, please wait
Year | Jan | Feb | Mar | Apr | May | Jun | Jul | Aug | Sep | Oct | Nov | Dec |
|---|---|---|---|---|---|---|---|---|---|---|---|---|
| 2008 | - | - | - | - | - | - | - | - | 3,479 | 3,661 | 4,312 | 3,505 |
| 2009 | 0 | 5,486 | 4,281 | 3,513 | 2,579 | 7,839 | 5,923 | 5,906 | 5,461 | 6,405 | 6,724 | 7,889 |
| 2010 | 9,010 | 3,937 | 6,317 | 8,115 | 8,983 | 8,562 | 4,625 | 6,070 | 8,337 | 8,563 | 5,859 | 2,442 |
| 2011 | 8,097 | 7,666 | 7,537 | 5,226 | 6,696 | 7,618 | 6,040 | 3,411 | 4,121 | 3,274 | 2,499 | 995 |
| 2012 | 2,758 | 1,140 | 1,979 | 2,512 | 3,428 | 2,264 | 3,264 | 2,060 | 1,182 | 864 | 614 | 454 |
| 2013 | 1,110 | 922 | 1,261 | 854 | 413 | 462 | 267 | 255 | 346 | 158 | 146 | 116 |
| 2014 | 116 | 47 | 30 | 186 | 90 | 3 | 16 | 8 | 4 | 0 | 102 | 198 |
| 2015 | 2 | 10 | 122 | 0 | 2 | 2,688 | 0 | 240 | 0 | 0 | 0 | 505 |
| 2016 | 0 | 1 | 16 | 190 | 3,751 | 0 | 429 | 2,216 | 32 | 1,477 | 2 | 625 |
| 2017 | 624 | 672 | 768 | 0 | 864 | 192 | 816 | 0 | 720 | 2,016 | 2,400 | 1,056 |
| 2018 | 1,392 | 480 | 2,160 | 960 | 914 | 1,200 | 48 | 0 | 720 | 0 | 0 | 0 |
| Total | 23,109 | 20,361 | 24,471 | 21,556 | 27,720 | 30,828 | 21,428 | 20,166 | 24,402 | 26,418 | 22,658 | 17,785 |
Loading, please wait
Year | Q1 | Q2 | Q3 | Q4 |
|---|---|---|---|---|
| 2008 | - | - | 3,479 | 11,478 |
| 2009 | 9,767 | 13,931 | 17,290 | 21,018 |
| 2010 | 19,264 | 25,660 | 19,032 | 16,864 |
| 2011 | 23,300 | 19,540 | 13,572 | 6,768 |
| 2012 | 5,877 | 8,204 | 6,506 | 1,932 |
| 2013 | 3,293 | 1,729 | 868 | 420 |
| 2014 | 193 | 279 | 28 | 300 |
| 2015 | 134 | 2,690 | 240 | 505 |
| 2016 | 17 | 3,941 | 2,677 | 2,104 |
| 2017 | 2,064 | 1,056 | 1,536 | 5,472 |
| 2018 | 4,032 | 3,074 | 768 | 0 |
| Total | 67,941 | 80,104 | 65,996 | 66,861 |
Loading, please wait
Year | Sales |
|---|---|
| 2018 | 7,874 |
| 2017 | 10,128 |
| 2016 | 8,739 |
| 2015 | 3,569 |
| 2014 | 800 |
| 2013 | 6,310 |
| 2012 | 22,519 |
| 2011 | 63,180 |
| 2010 | 80,820 |
| 2009 | 62,006 |
| 2008 | 14,957 |
| Total | 280,902 |
Download Historic Sales Data
Embedded Code
See more widgetsSources: Manufacturers