Key Stats
How many Optima did Kia sell in 2021?
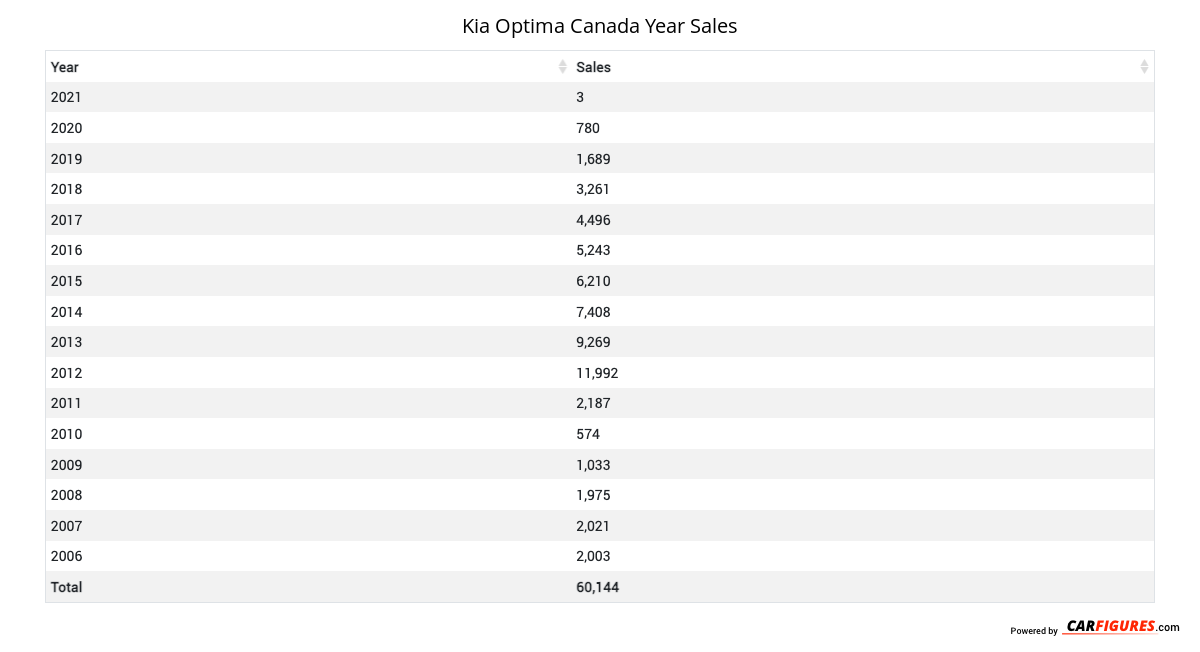
Kia sold 3 Optima in 2021. In 2020, Kia sold 780 Optima. They sold 777 more units in year 2020 compared to 2021 with a percent loss of 99.62% YoY.
Overview
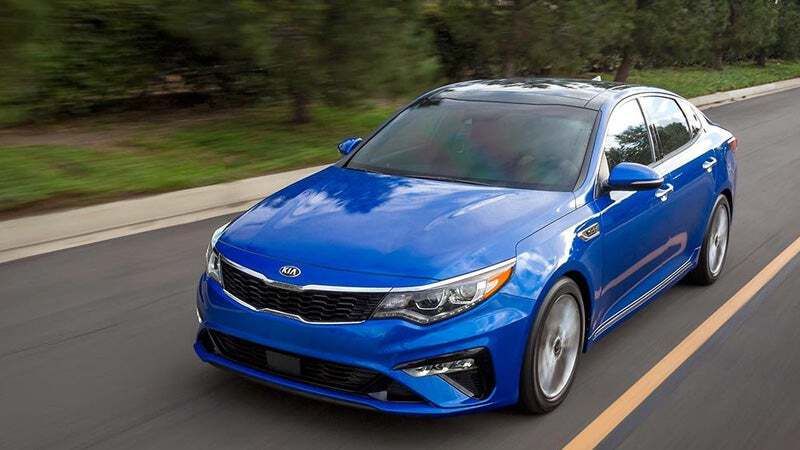
The 2020 Kia Optima is a vehicle from automaker Kia.
How Much Does the 2020 Kia Optima Cost?
The 2020 Kia Optima starts at $28,495 MSRP. Fully loaded, the Kia Optima will cost you about $29,995.
Kia Optima Engine, Transmission, and Performance Numbers
Kia Optima is powered by a front-wheel-drive powertrain that makes 185 horsepower and 178 ft-lb torque.
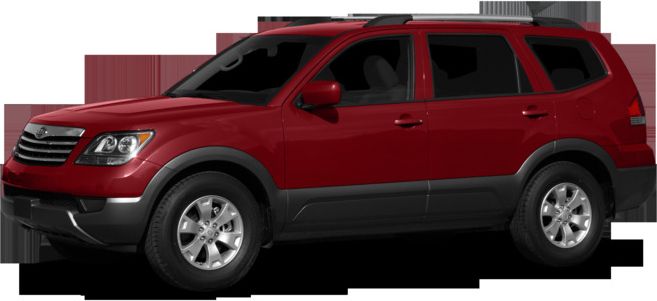
List of Kia Optima Competitors
Some of Kia Optima competitors include the Hyundai Sonata, Subaru Legacy, Nissan Altima, Mazda Mazda6, Toyota Camry, Honda Civic, Subaru Impreza, Hyundai Elantra, Nissan Sentra and Nissan Maxima.
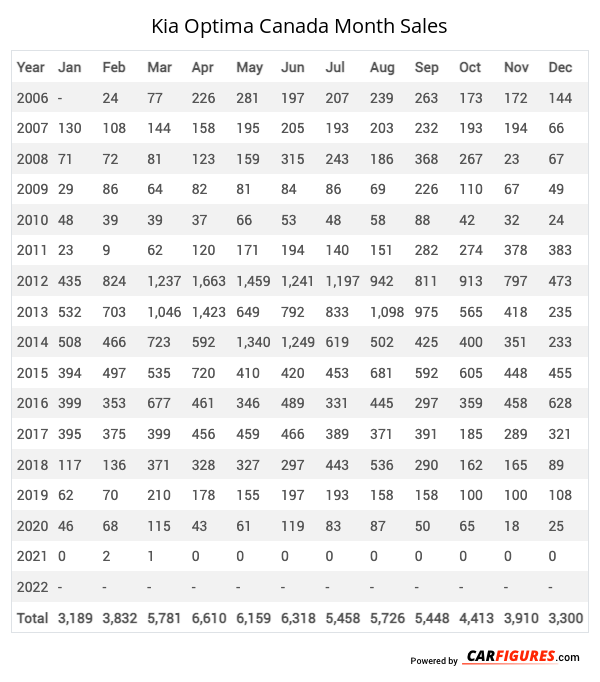
Kia Optima Canadian Sale figures by year, quarter, and month are presented below. Including the most up to date sales data for the Kia Optima. See how the Kia Optima stacks up the other models in the Cars, Midsize Cars segments.
*Sales report includes Optima, Magentis
Year | Jan | Feb | Mar | Apr | May | Jun | Jul | Aug | Sep | Oct | Nov | Dec |
|---|---|---|---|---|---|---|---|---|---|---|---|---|
| 2006 | - | 24 | 77 | 226 | 281 | 197 | 207 | 239 | 263 | 173 | 172 | 144 |
| 2007 | 130 | 108 | 144 | 158 | 195 | 205 | 193 | 203 | 232 | 193 | 194 | 66 |
| 2008 | 71 | 72 | 81 | 123 | 159 | 315 | 243 | 186 | 368 | 267 | 23 | 67 |
| 2009 | 29 | 86 | 64 | 82 | 81 | 84 | 86 | 69 | 226 | 110 | 67 | 49 |
| 2010 | 48 | 39 | 39 | 37 | 66 | 53 | 48 | 58 | 88 | 42 | 32 | 24 |
| 2011 | 23 | 9 | 62 | 120 | 171 | 194 | 140 | 151 | 282 | 274 | 378 | 383 |
| 2012 | 435 | 824 | 1,237 | 1,663 | 1,459 | 1,241 | 1,197 | 942 | 811 | 913 | 797 | 473 |
| 2013 | 532 | 703 | 1,046 | 1,423 | 649 | 792 | 833 | 1,098 | 975 | 565 | 418 | 235 |
| 2014 | 508 | 466 | 723 | 592 | 1,340 | 1,249 | 619 | 502 | 425 | 400 | 351 | 233 |
| 2015 | 394 | 497 | 535 | 720 | 410 | 420 | 453 | 681 | 592 | 605 | 448 | 455 |
| 2016 | 399 | 353 | 677 | 461 | 346 | 489 | 331 | 445 | 297 | 359 | 458 | 628 |
| 2017 | 395 | 375 | 399 | 456 | 459 | 466 | 389 | 371 | 391 | 185 | 289 | 321 |
| 2018 | 117 | 136 | 371 | 328 | 327 | 297 | 443 | 536 | 290 | 162 | 165 | 89 |
| 2019 | 62 | 70 | 210 | 178 | 155 | 197 | 193 | 158 | 158 | 100 | 100 | 108 |
| 2020 | 46 | 68 | 115 | 43 | 61 | 119 | 83 | 87 | 50 | 65 | 18 | 25 |
| 2021 | 0 | 2 | 1 | 0 | 0 | 0 | 0 | 0 | 0 | 0 | 0 | 0 |
| 2022 | - | - | - | - | - | - | - | - | - | - | - | - |
| Total | 3,189 | 3,832 | 5,781 | 6,610 | 6,159 | 6,318 | 5,458 | 5,726 | 5,448 | 4,413 | 3,910 | 3,300 |
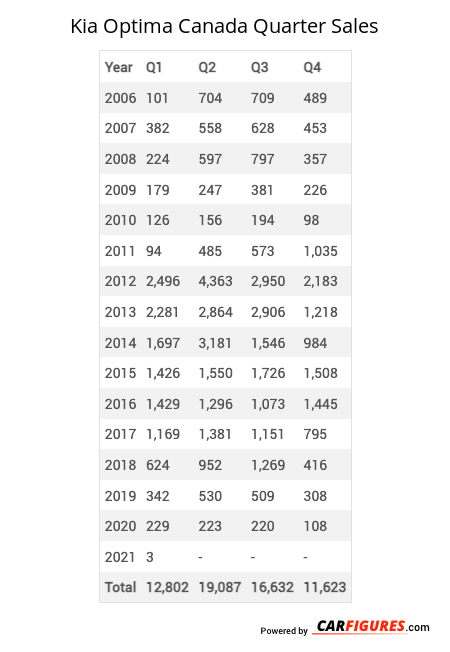
Year | Q1 | Q2 | Q3 | Q4 |
|---|---|---|---|---|
| 2006 | 101 | 704 | 709 | 489 |
| 2007 | 382 | 558 | 628 | 453 |
| 2008 | 224 | 597 | 797 | 357 |
| 2009 | 179 | 247 | 381 | 226 |
| 2010 | 126 | 156 | 194 | 98 |
| 2011 | 94 | 485 | 573 | 1,035 |
| 2012 | 2,496 | 4,363 | 2,950 | 2,183 |
| 2013 | 2,281 | 2,864 | 2,906 | 1,218 |
| 2014 | 1,697 | 3,181 | 1,546 | 984 |
| 2015 | 1,426 | 1,550 | 1,726 | 1,508 |
| 2016 | 1,429 | 1,296 | 1,073 | 1,445 |
| 2017 | 1,169 | 1,381 | 1,151 | 795 |
| 2018 | 624 | 952 | 1,269 | 416 |
| 2019 | 342 | 530 | 509 | 308 |
| 2020 | 229 | 223 | 220 | 108 |
| 2021 | 3 | - | - | - |
| Total | 12,802 | 19,087 | 16,632 | 11,623 |
Year | Sales |
|---|---|
| 2021 | 3 |
| 2020 | 780 |
| 2019 | 1,689 |
| 2018 | 3,261 |
| 2017 | 4,496 |
| 2016 | 5,243 |
| 2015 | 6,210 |
| 2014 | 7,408 |
| 2013 | 9,269 |
| 2012 | 11,992 |
| 2011 | 2,187 |
| 2010 | 574 |
| 2009 | 1,033 |
| 2008 | 1,975 |
| 2007 | 2,021 |
| 2006 | 2,003 |
| Total | 60,144 |
Download Historic Sales Data
Embedded Code
See more widgetsSources: Manufacturers