Last updated: January 03, 2024

Overview
The 2019 Ford Flex is a vehicle from automaker Ford.
How Much Does the 2019 Ford Flex Cost?
The 2019 Ford Flex starts at $32,649 MSRP. Fully loaded, the Ford Flex will cost you about $46,449.
Ford Flex Engine, Transmission, and Performance Numbers
Ford Flex is powered by a front-wheel-drive powertrain that makes 287 horsepower and 254 ft-lb torque.
List of Ford Flex Competitors
Some of Ford Flex competitors include the GMC Acadia, GMC Terrain, Chevrolet Blazer, Chevrolet Traverse, Chevrolet Equinox, Dodge Journey, Dodge Durango, GMC Yukon, GMC Yukon XL, Chevrolet Trax, Ford Edge and Hyundai Santa Fe XL.
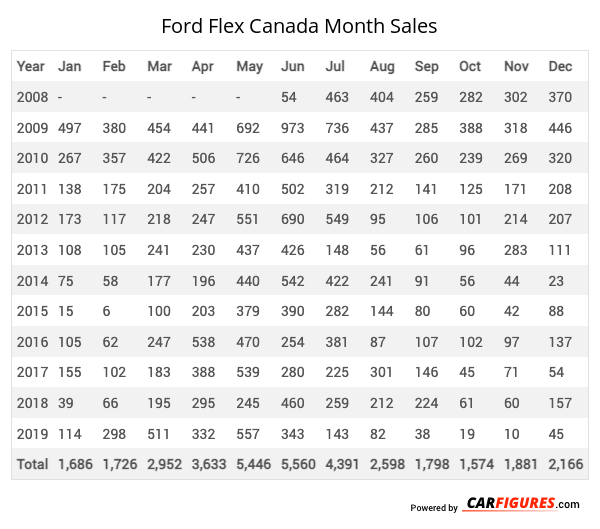
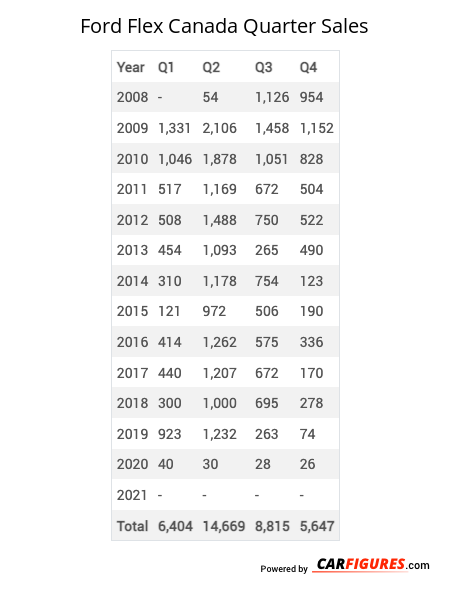
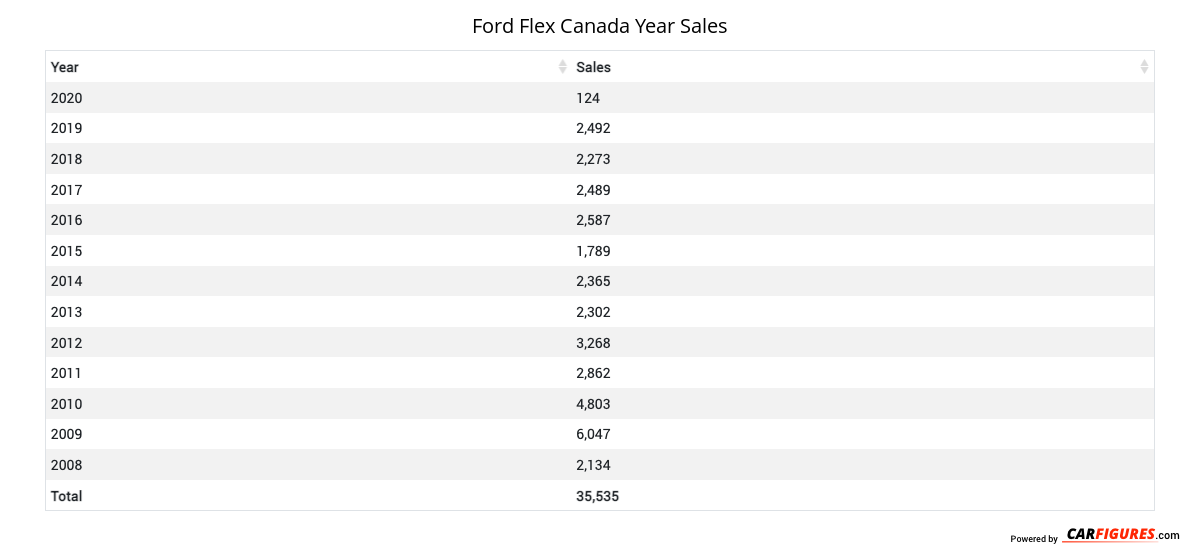
Ford Flex Canadian Sale figures by year, quarter, and month are presented below. Including the most up to date sales data for the Ford Flex. See how the Ford Flex stacks up the other models in the Crossover/SUVS, Midsize Crossover/SUVs segments.
For sales numbers of the Ford Flex in US, click here.
| Year | Jan | Feb | Mar | Apr | May | Jun | Jul | Aug | Sep | Oct | Nov | Dec |
|---|---|---|---|---|---|---|---|---|---|---|---|---|
| 2008 | - | - | - | - | - | 54 | 463 | 404 | 259 | 282 | 302 | 370 |
| 2009 | 497 | 380 | 454 | 441 | 692 | 973 | 736 | 437 | 285 | 388 | 318 | 446 |
| 2010 | 267 | 357 | 422 | 506 | 726 | 646 | 464 | 327 | 260 | 239 | 269 | 320 |
| 2011 | 138 | 175 | 204 | 257 | 410 | 502 | 319 | 212 | 141 | 125 | 171 | 208 |
| 2012 | 173 | 117 | 218 | 247 | 551 | 690 | 549 | 95 | 106 | 101 | 214 | 207 |
| 2013 | 108 | 105 | 241 | 230 | 437 | 426 | 148 | 56 | 61 | 96 | 283 | 111 |
| 2014 | 75 | 58 | 177 | 196 | 440 | 542 | 422 | 241 | 91 | 56 | 44 | 23 |
| 2015 | 15 | 6 | 100 | 203 | 379 | 390 | 282 | 144 | 80 | 60 | 42 | 88 |
| 2016 | 105 | 62 | 247 | 538 | 470 | 254 | 381 | 87 | 107 | 102 | 97 | 137 |
| 2017 | 155 | 102 | 183 | 388 | 539 | 280 | 225 | 301 | 146 | 45 | 71 | 54 |
| 2018 | 39 | 66 | 195 | 295 | 245 | 460 | 259 | 212 | 224 | 61 | 60 | 157 |
| 2019 | 114 | 298 | 511 | 332 | 557 | 343 | 143 | 82 | 38 | 19 | 10 | 45 |
| Total | 1686 | 1726 | 2952 | 3633 | 5446 | 5560 | 4391 | 2598 | 1798 | 1574 | 1881 | 2166 |
| Year | Q1 | Q2 | Q3 | Q4 |
|---|---|---|---|---|
| 2008 | - | 54 | 1126 | 954 |
| 2009 | 1331 | 2106 | 1458 | 1152 |
| 2010 | 1046 | 1878 | 1051 | 828 |
| 2011 | 517 | 1169 | 672 | 504 |
| 2012 | 508 | 1488 | 750 | 522 |
| 2013 | 454 | 1093 | 265 | 490 |
| 2014 | 310 | 1178 | 754 | 123 |
| 2015 | 121 | 972 | 506 | 190 |
| 2016 | 414 | 1262 | 575 | 336 |
| 2017 | 440 | 1207 | 672 | 170 |
| 2018 | 300 | 1000 | 695 | 278 |
| 2019 | 923 | 1232 | 263 | 74 |
| 2020 | 40 | 30 | 28 | 26 |
| 2021 | - | - | - | - |
| Total | 6404 | 14669 | 8815 | 5647 |
| Year | Sales |
|---|---|
| 2020 | 124 |
| 2019 | 2492 |
| 2018 | 2273 |
| 2017 | 2489 |
| 2016 | 2587 |
| 2015 | 1789 |
| 2014 | 2365 |
| 2013 | 2302 |
| 2012 | 3268 |
| 2011 | 2862 |
| 2010 | 4803 |
| 2009 | 6047 |
| 2008 | 2134 |
| Total | 35535 |
Download Historic Sales Data
Looking for more data/visualizations? Send us an email at [email protected] for customized data aggregates and visualizations.Embedded Code
See more widgetsSources: Manufacturers


